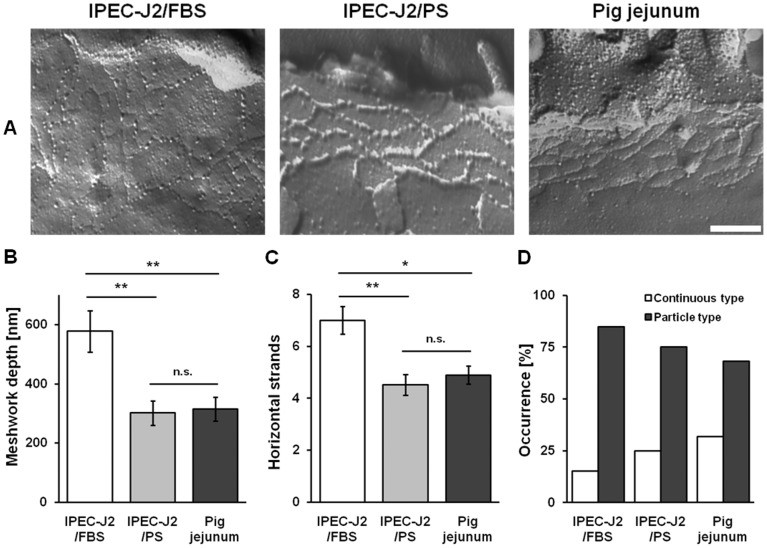
Figure 4. PS approximates tight junction ultrastructure of IPEC-J2 to pig jejunum.
(A) Freeze-fracture images of IPEC-J2/FBS, IPEC-J2/PS, and pig jejunal tissue (scale bar: 200 nm). (B) Morphometric analysis of the TJ meshwork depth, (C) the number of horizontal strands, and (D) the TJ strand type (continuous vs. particle type). IPEC-J2/PS, n = 22; IPEC-J2/FBS, n = 23; pig jejunum, n = 20; n.s., not significant; *, p<0.05; **, p<0.01.

