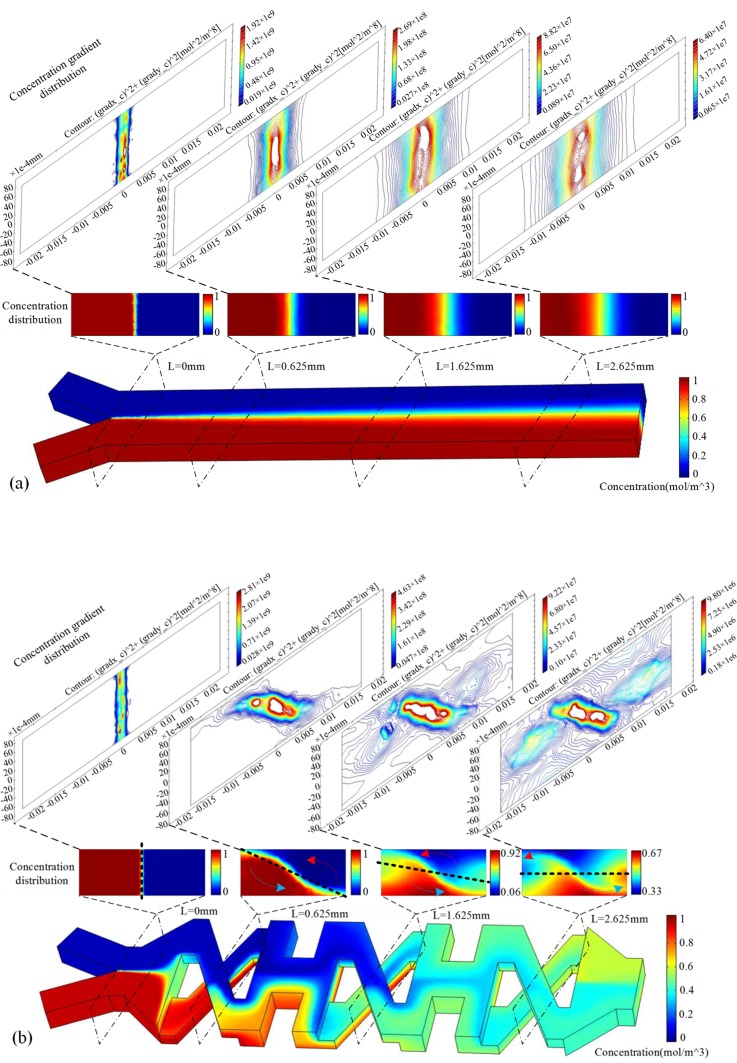
Figure 3.
Comparison of mixing results between model XH and the straight mixer without structure on the wall. L indicates the mixer length. (a) Mixing of the straight mixer and the distribution of concentration and concentration gradient from L = 0 mm to L = 2.625 mm at Re = 0.563; (b) mixing of the first two and a half cycles of model XH and the distribution of concentration and concentration gradient at Re = 0.563, the sampled planes are A1, C1, C2, etc., as depicted in Fig. 1b.

