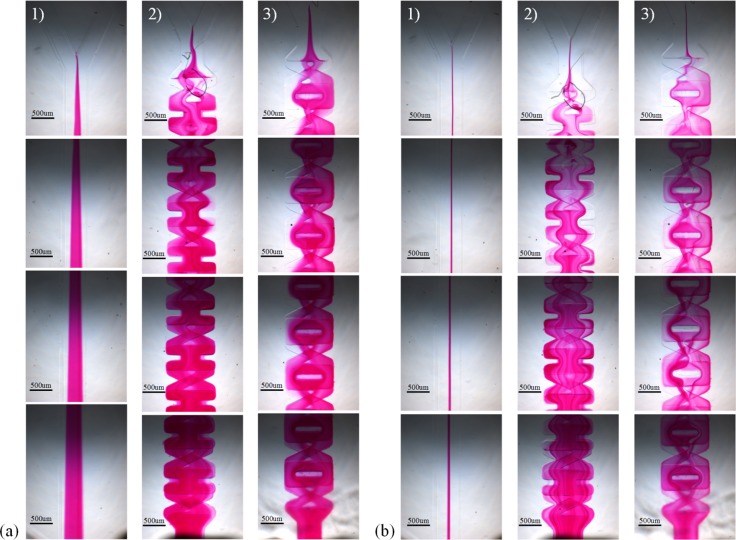
Figure 6.
Compare the experimental mixing results of these three mixers at two different Reynolds numbers. The scale bar is 500 μm. (a) The mixing results of the straight mixer, the mixer XH and the mixer XO at Re = 0.3, displayed from the left column to the right, i.e., from column (1) to column 3) in (a). (b) The mixing results of the straight mixer, the mixer XH and the mixer XO at Re = 6 displayed from the left column to the right, i.e., from column (1) to column (3) in (b).

