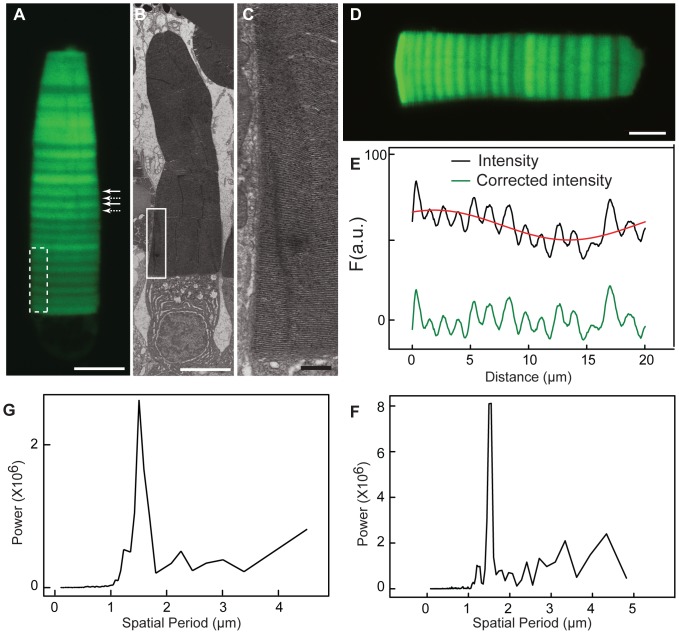
Figure 1. Periodic axial variation in fluorescence intensity in OS expressing a Rho-eGFP transgene.
(A) The expression profile of OS (OS) demonstrates a varying level of Rho-eGFP in disk membranes along the OS axis in animals housed in a 24 h (12D:12L) cycle. Periodic axial variation is seen as alternating series of bright fluorescent regions (solid arrows) and dim regions (dotted arrows).(B, C) Electron micrographs of a rod photoreceptor, expressing Rho-eGFP, show equal spacing between disk membranes. Panel C is an enlargement of white box in panel B. The dotted white box in panel A illustrates a similar sized area for comparison. White bar is 5 µm and black bar is 200nm. (D, E) A rod expressing Rho-eGFP was analyzed to determine the intensity difference at peaks and troughs. The green trace represents the periodic variation in fluorescence intensity before (black trace) and after (green trace) subtraction of the aperiodic axial variation fit to a sinusoidal function (red trace). The amplitude of the variation between the maximum and minimum for each period was1.3±0.07 (mean ± S.D.) calculated from 90 periods taken from10 cells.(F) Fourier transform analysis of the proximal 20 µm of the OS shown in panel (B) demonstrates a peak at 1.5 µm representing the period of axial variation. The Fourier transform spectra are presented in terms of the spatial periods, and not as the more typical frequencies.(G) Fourier transform analysis of the proximal 20 µm of the OS averaged from five different cells also shows a period at 1.5 µm.

