
Figure 2. Fluorescence recovery after photobleaching (FRAP) in a live rod expressing Rho-eGFP.
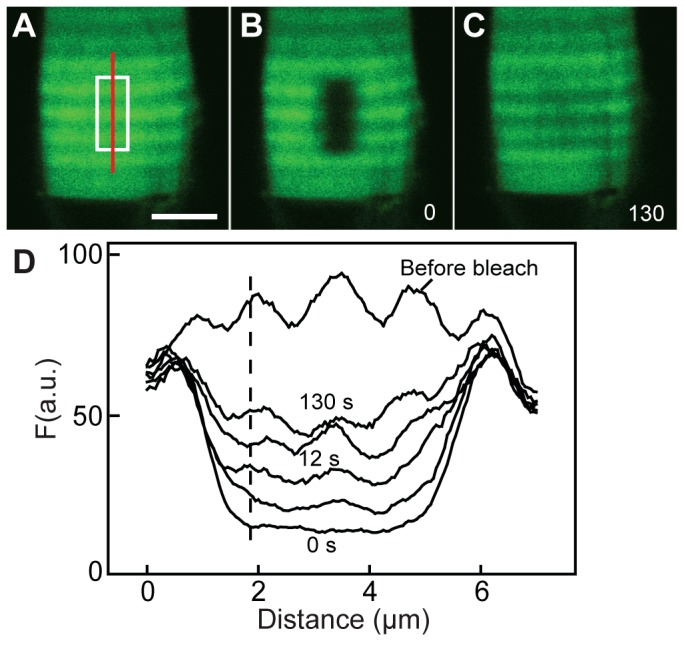
(A–C) Sequential fluorescent images from a cell are shown before (A), immediately after photobleaching (B) and 130 s later (C). The target area is highlighted in A with a white box.(D) The fluorescence intensity profile scanned through the photobleached area (red line in panel A) demonstrates the recovery of the banding pattern in register with the non-bleached neighboring area.