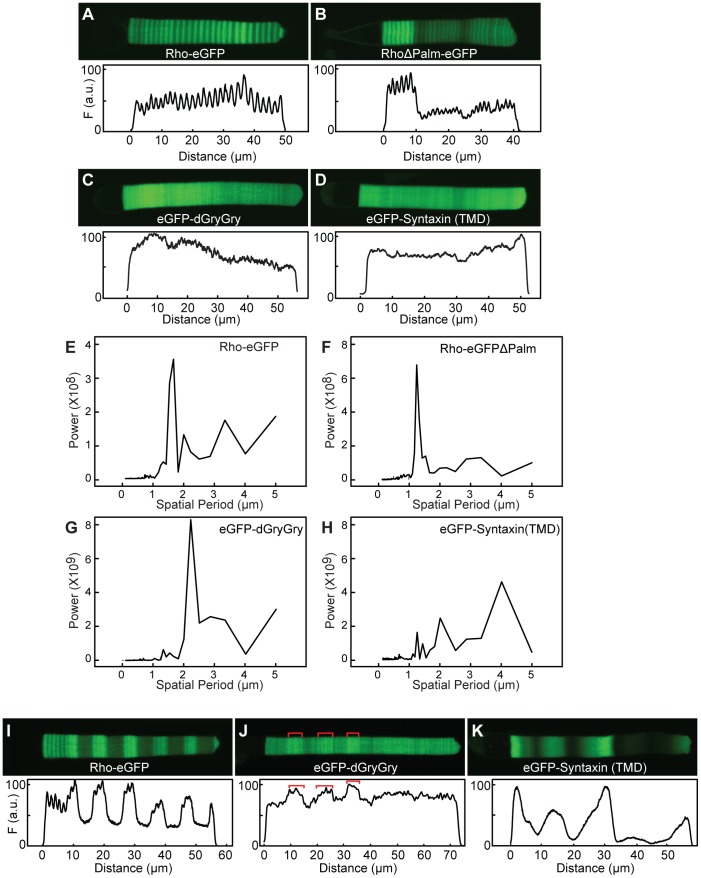
Figure 9. Axial variation of rhodopsin C-terminal mutants and membrane associated eGFP transgenes.
Transgenic animals expressing the indicated transgene were housed in either a 24(12D:12L, A–D) or 168 h (84L:84D, I–K) light cycle. Representative cells and intensity profilesfrom animals housed in a 24 h (12D:12L) are shown. (E–H) Power spectra of the axial fluorescence intensity distribution from cells expressing the indicated transgenes. To enable comparisons of the power between different cells, the total OS fluorescence intensity for each cell was set to 1 and then the fluorescence intensity distribution was normalized to that value. Note the scales in E and F are different than G and H. RhoΔPalm-eGFP has the palmitoylation sites deleted (C322S and C323T), eGFP-dGyrGy contains two geranylgeranyl acceptor sites and eGFP-Syntaxin(TMD) has eGFP fused with the transmembrane domain from syntaxin.

