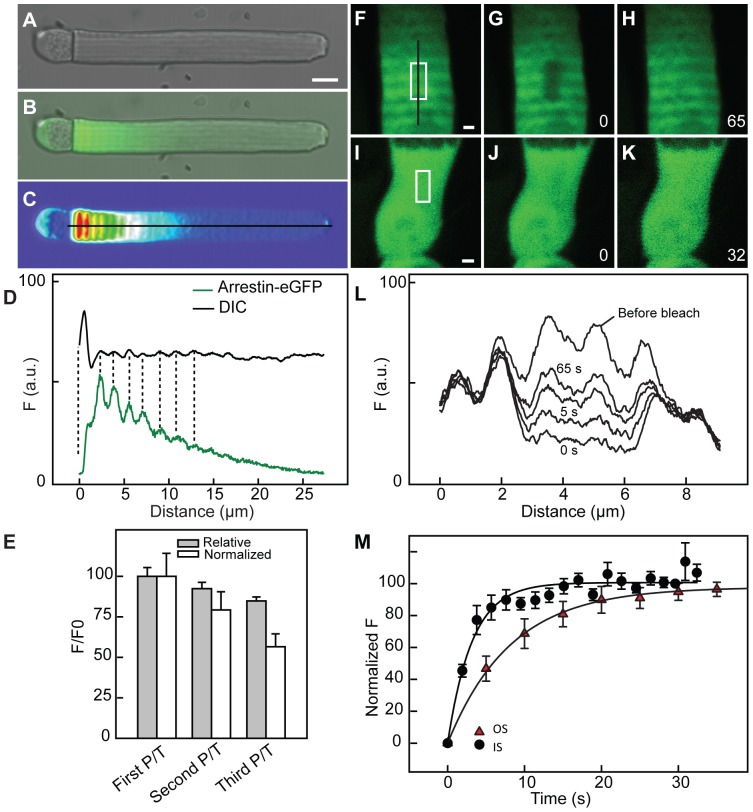
Figure 10. Axial variation of arrestin-eGFP transgenes in the OS.
(A–E) A retinal explant from transgenic frogs expressing soluble arrestin-eGFP in rods was dark adapted and then moved to light for an hour before the live imaging. Arrestin-eGFP demonstrated axial variation in fluorescence at the base of the OS with a period of 1–1.4 µm that was synchronized with the DIC variation. The intensity profiles of the cell for both variations are shown (D). The intensity of the fluorescence decreased along the OS and the amplitude of the variation between peak (P) and neighboring trough (T) also decreased. The first peak was ∼35% brighter than the next trough (N = 5 cells, p<0.03). Peak/trough ratios (P/T) were calculated for the first three light cycles closest to the base and then normalized to the first peak which was set 100% (Relative) and also after normalization to the mean (Normalized). Error bars represent standard deviation and each of the three bands were statistically different (N = 5 cells, ANOVA p<0.0003). (F–M) Fluorescence recovery after photobleaching. The light adapted rod with arrestin-eGFP in the OS (F–H, L) and IS (I–K) was photobleached within an area near the base of the OS (white box) in panels (F, I) and the fluorescence recovery of the photobleached area was recorded continuously. The intensity profile of this recovery along the black line in panel (F) is shown in panel (L) as a function of time. There is recovery after photobleaching within 65 seconds in the OS, regenerating the axial banding pattern with the same spatial period as neighboring regions. The IS arrestin-eGFP recovered faster that that in the OS. White bars are 1 µm.

