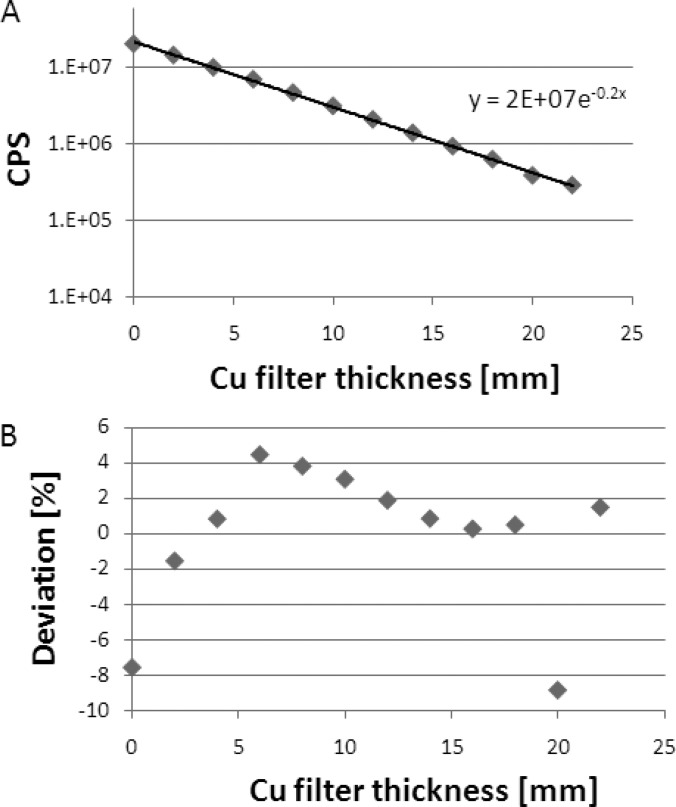
Figure 8.
(a) The measured count rate as a function of copper thickness. The curve follows a linear-attenuation decay model with a linear-attenuation coefficient of 0.2 mm −1. The linear response of the count rate was verified up to ∼20 Mcps. The uncertainty in each data marker is ≪1%. (b) The maximum deviation of the data from the model is 9%, which suggests that the data fit the linear-attenuation model.

