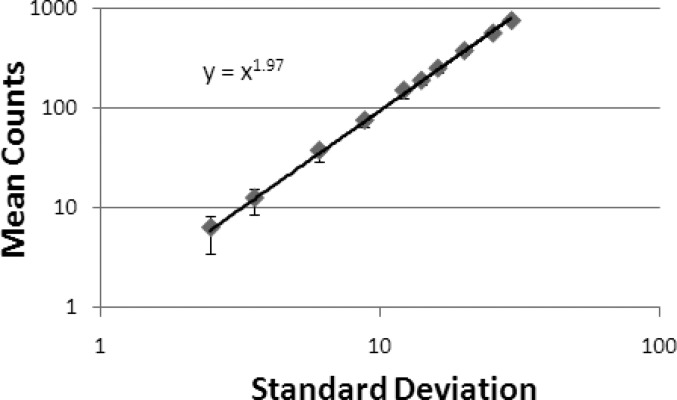
Figure 9.
The noise characteristic graph shows the standard deviation as a function of the mean pixel counts. The power fit shows that the mean pixel count is proportional to the standard deviation to the power of 1.97, which matches the property of ideal Poisson distribution, i.e., the mean pixel count is proportional to the square of the standard deviation.

