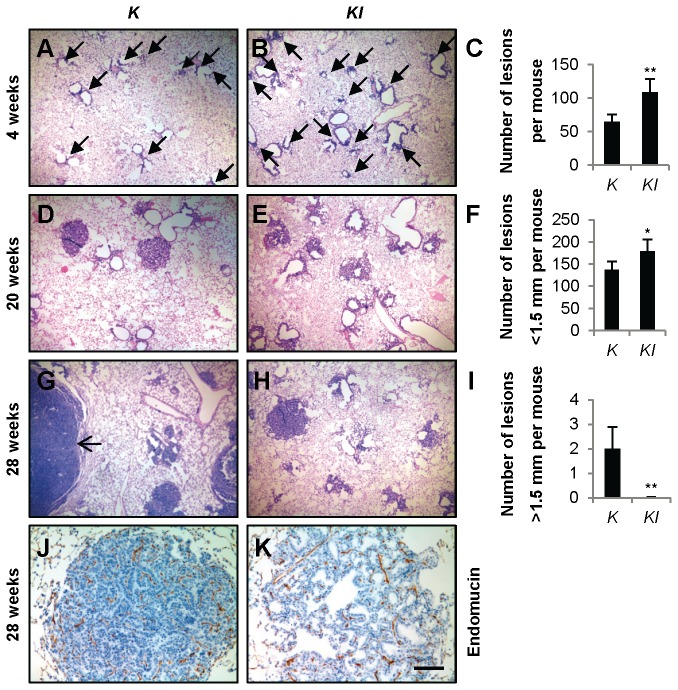
Figure 1. IL-6 deletion promotes tumorigenesis but retards tumor progression of Kras G12D-driven lung cancer.
(A and B) Representative images of H&E-stained lung tissue sections from (A) K and (B) KI mice 4 weeks post-infection with adeno-Cre. Arrows indicate early lesions. (C) Quantification of lesions in K (n=3) and KI (n=5) mice 4 weeks post-infection with adeno-Cre. Data are shown as mean + s.e.m. **P<0.01. (D and E) Representative images of H&E-stained lung tissue sections from (D) K and (E) KI mice 20 weeks post-infection with adeno-Cre. (F) Quantification of small lesions (<1.5 mm) in K and KI mice (n=6) 28 weeks post-infection with adeno-Cre. Data shown are mean + s.e.m. *P<0.05. (G and H) Representative images of H&E-stained lung tissue sections from (G) K and (H) KI mice28 weeks post-infection with adeno-Cre. Arrow indicates a large tumor. (I) Quantification of large tumors (>1.5 mm) in K and KI mice (n=6) 28 weeks post-infection with adeno-Cre. Data shown are mean + s.e.m. **P<0.01. (J and K) Representative images of Endomucin-stained lung tissue sections from (J) K and (K) KI mice 28 weeks post-infection with adeno-Cre. Scale bar indicates 500 μm in (A, B, D, E, G and H), or 100 μm in (J and K). Abbreviations: K=Kras G12D. KI=Kras G12D; IL-6 -/-.

