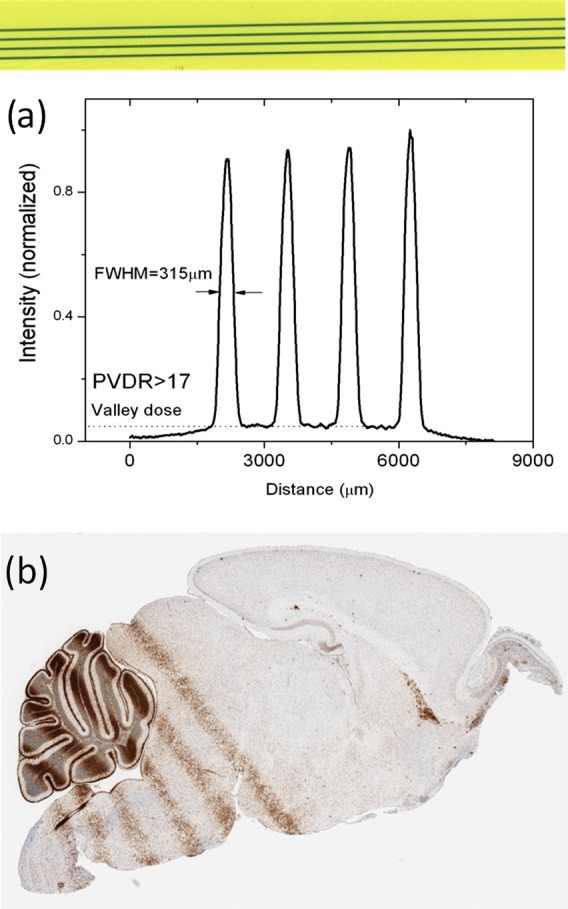
Figure 7.

(a) Irradiated film and dose profile displaying our peak to valley dose ratio given a center to center separation of 1.4 mm between the microbeams. (The intensity variation seen here is due to slight non-uniformity in focal line position and collimator transmission under tube heating during continual use.) (b) Histological image of microbeam DNA damage in a mouse brain. Cell staining was done with γ-H2AX labeling, and the peak entrance dose given was 13 Gy per microbeam.
