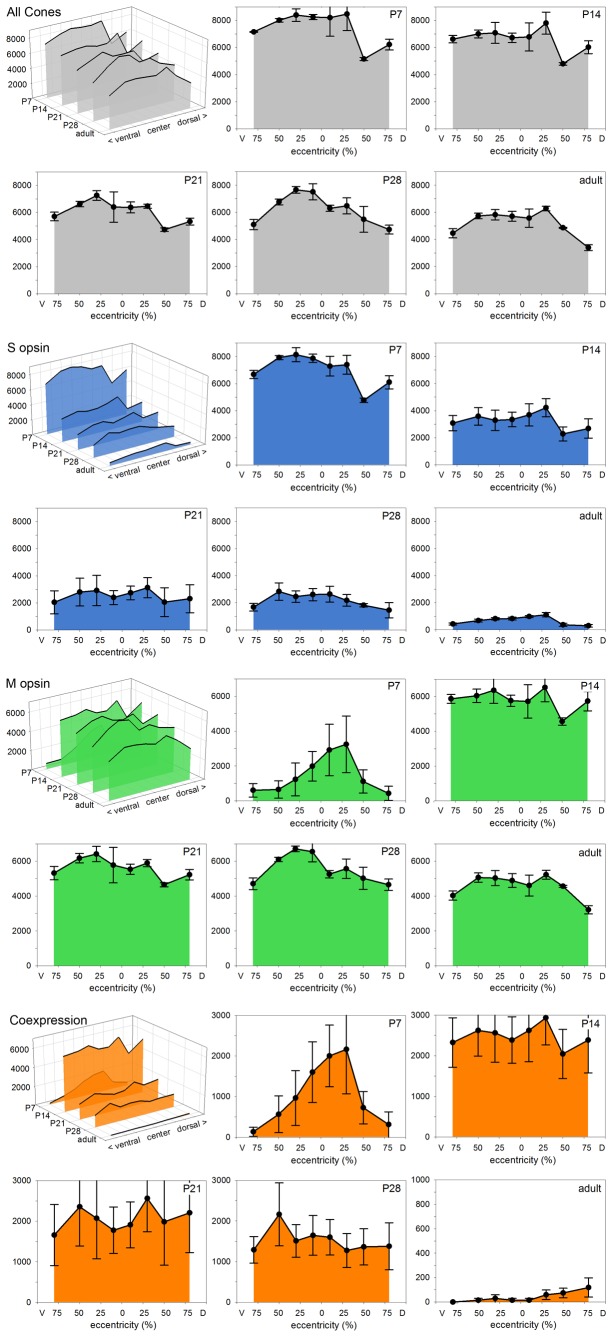
Figure 6. Postnatal development of cone opsin expression.
The four colored blocks show the development of cone properties along the dorso-ventral axis of the retina from postnatal day P7 to adulthood. Each block contains a 3D diagram summarizing the progression of a property across the retina and over time, and the individual diagrams for each time point. For each time point, the cones were counted in three wildtype retinae double-immunolabeled for M and S opsin, data points give mean values and SEM. Top block (grey): Total cone density shows a decline with age, because of retinal areal growth. Second block (blue): Density of S opsin-expressing cones. At P7 nearly all cones express S opsin, during subsequent retinal maturation the number of S opsin-expressing cones drops dramatically to adult values. Third block (green): The density of M opsin-expressing cones is low at P7 and is highest in the central retina that leads maturation. During subsequent maturation, the number of M opsin-expressing cones increases to adult values. Bottom block (orange): Density of cones coexpressing M and S opsin, comprising practically all M opsin-expressing cones at P7 and a decreasing proportion of the cones at later stages. All vertical axes give cone densities (cones/mm²), eccentricities are given as in Figure 5.

