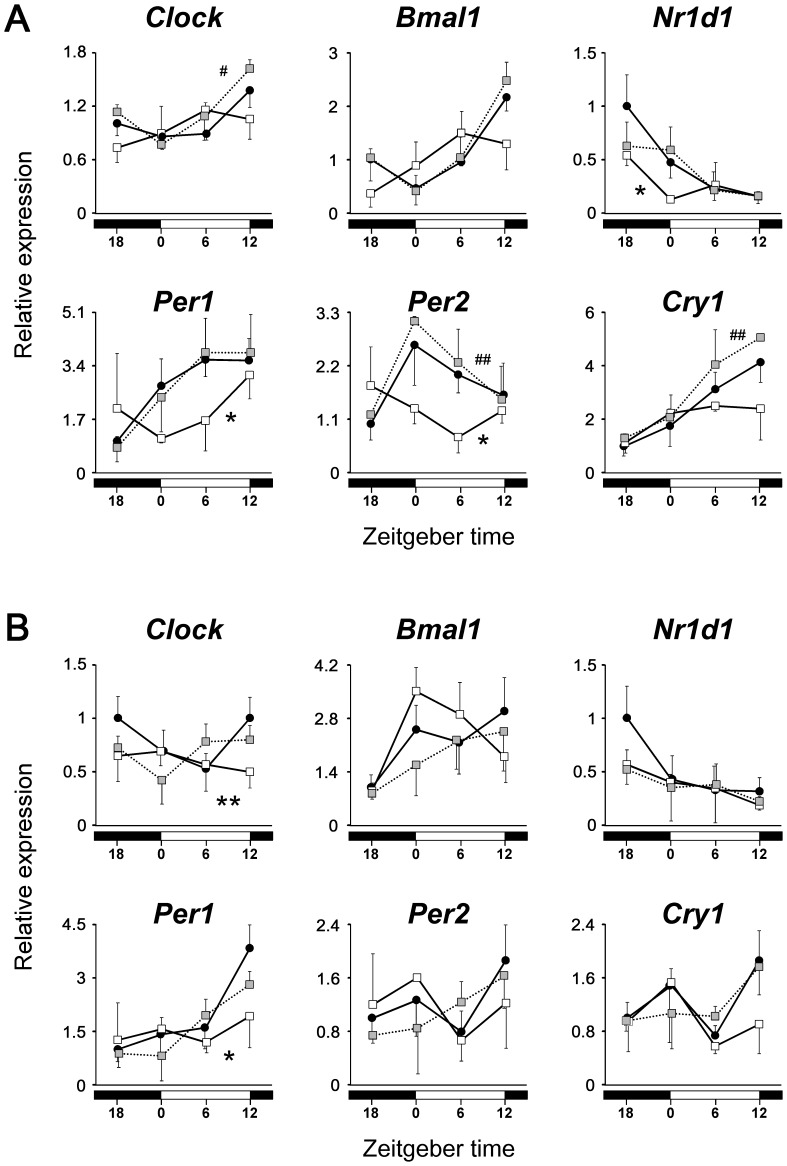
Figure 5. Effects of repeated administration of exendin-4 or exendin-(9–39) on daily mRNA expression profiles of clock genes in liver (A) and adipose tissue (B) (Experiment 4).
Mice were fasted for 24-4 (white squares, n = 3 per time point), exendin-(9–39) (gray squares, n = 3–4 per time point), or vehicle (black circles, n = 5–6 per time point) at ZT 12. The mean value at ZT 18 in the control group was set to 1, and data represent means and SD. The differences of daily mRNA expression rhythms between groups were assessed by two-way ANOVA followed by Bonferroni post hoc testing. *, P<0.05, **, P<0.01 vs. the control group; #, P<0.05, ##, P<0.01 vs. the exendin-4 group.

