
Fig. 3.
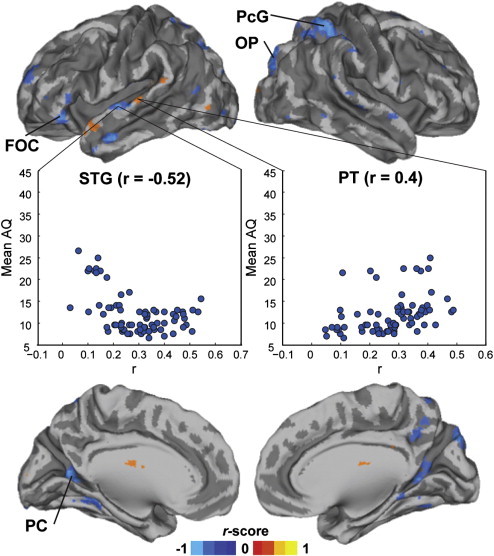
Volume renders of the brain showing areas with significant (P < 0.05 FDR corrected) correlation between ISC and AQ (Mantel test) across NT participants. Scatter plots are for visualization only and this data were not subjected to statistical testing. PcG, precentral gyrus; OP, occipital pole; FOC, frontal orbital cortex; STG, superior temporal gyrus; PT, planum temprorale; PC, precuneus cortex.