
Fig. 1.
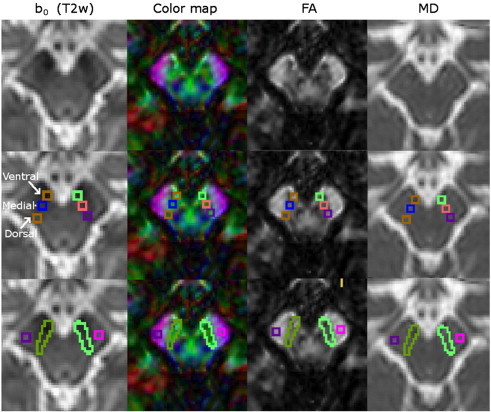
Example of a DTI scan of a healthy control and ROI positions in the SN and control regions.
Columns represent: 1st: T2 weighted b0 image; 2nd: colour coded map of the principle eigenvector of the diffusion matrix; 3rd: FA map; and 4th: MD maps. ROIs are demonstrated in the second row for small ROI (analysis 1) and in the third row for total SN and control ROI in the cerebral peduncle (analysis 2).