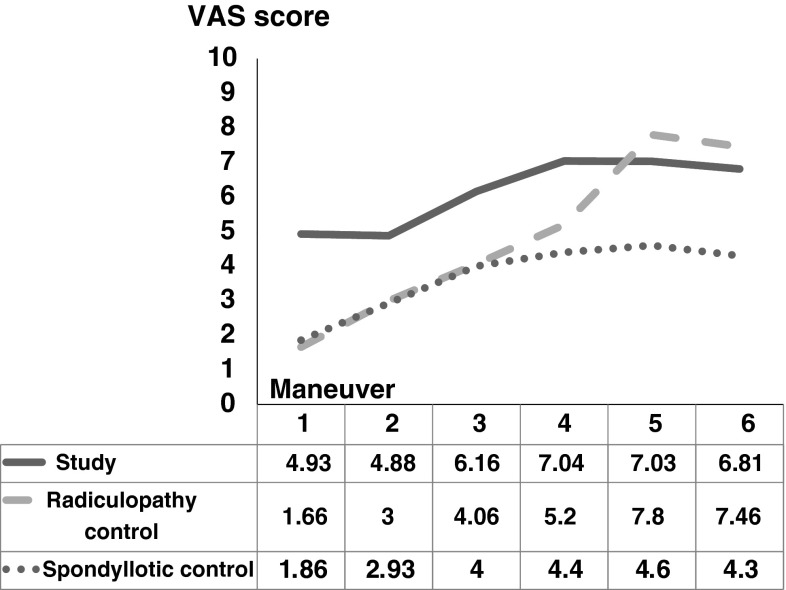
Fig. 5.
The diagram shows the mean VAS score in the study group compared with both control groups. The study group reported higher VAS scores (p = 0.004) compared with the group with spondylosis (dotted line) and similar VAS scores (p = 0.09) compared with the group with radiculopathy (dashed line).

