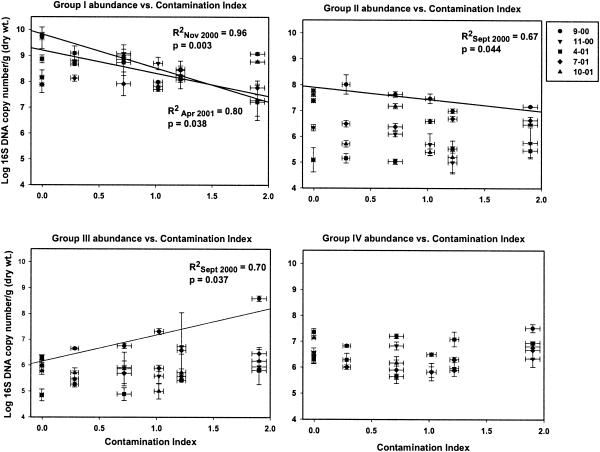
FIG. 4.
Means and standard errors of group-level abundances as measured by quantitative PCR versus the CI. Symbols for the sampling time points: •, September 2000; ▪, November 2000; ▴, April 2001; ▾, July 2001; ♦, October 2001. Regression lines are provided only for time points that indicated significant linear relationships between the group-level abundance and the CI. Data for samples taken in September 2000 were reported previously (23).

