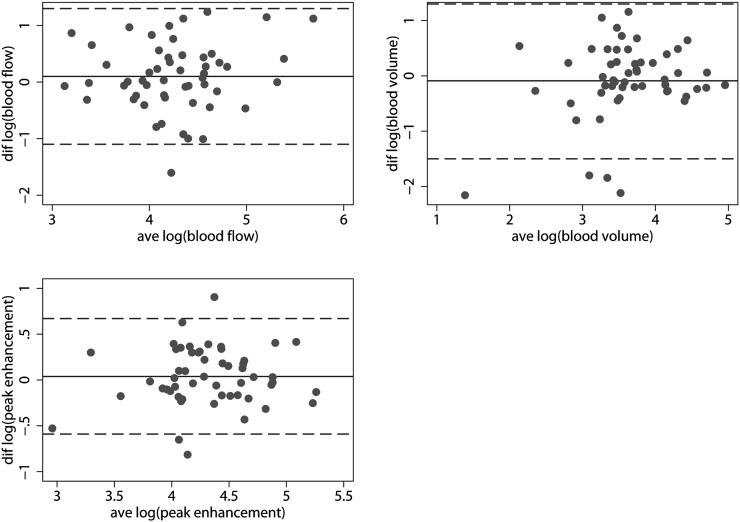
Figure 5.
Reproducibility data—small ROIs. (Left to right, top to bottom) agreement plots for log (blood flow), log (blood volume) and log (peak enhancement). Punctuated lines show the 95% limits of agreement; solid lines show the mean differences. Notice the broad 95% limits of agreement. ave, average; diff, difference; ROI, region of interest.

