Figure 2.

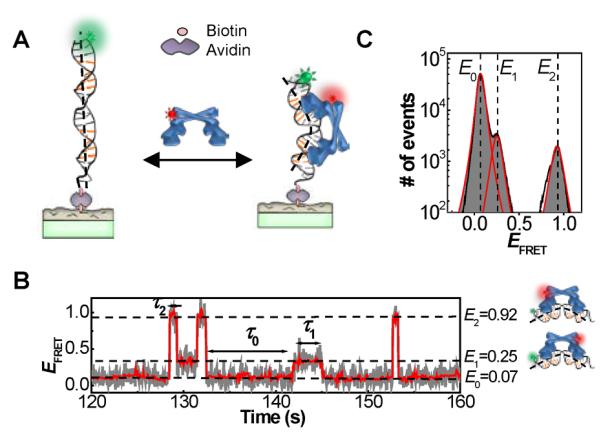
(A) Experimental scheme of surface immobilization of DNA; CueR is supplied in a continuously flowing solution. Upon CueR binding to DNA, FRET occurs from the donor Cy3 (green sphere) to the acceptor Cy5 (red sphere). (B) Single-molecule EFRET trajectory of an immobilized Cy3-DNA interacting with holo-CueRCy5-C129 (2 nM), where Cy5-C129 designates the labeling position on one monomer. τ0, τ1 and τ2 are the microscopic dwell times on the E0, E1 and E2 states, respectively. The cartoons on the right show CueRCy5-C129 in two binding orientations. (C) Histogram of EFRET trajectories as in B of holo-CueRCy5-C129–DNA interactions, showing the three EFRET states.
