
Figure 9.
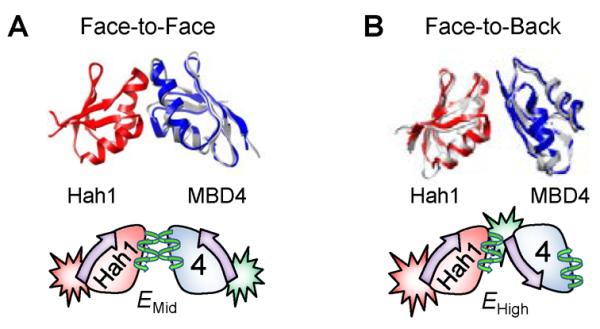
Structural models (top) of face-to-face (A) and face-to-back (B) Hah1–MBD4 interaction complexes with corresponding cartoon representations (bottom). In the cartoons, the “face” side of a protein is represented by a helix and the “back” side by an arrow. The FRET label positions are also indicated. Reprinted with permission from reference (96). Copyright 2012 American Chemical Society.