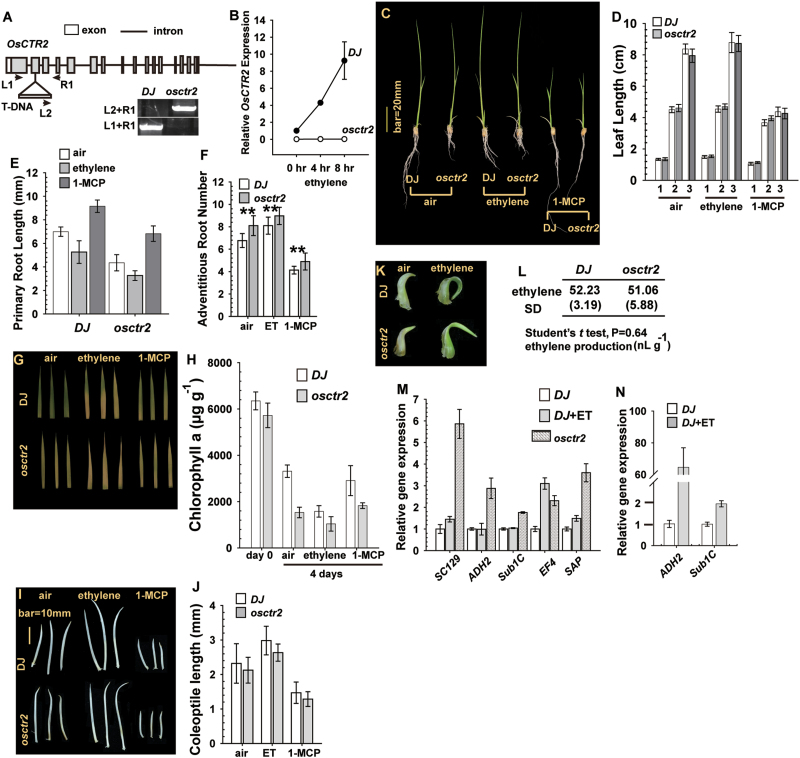
Fig. 3.
Phenotype analysis of osctr2. (A) Diagram of the OsCTR2 gene structure; the T-DNA insertion site in osctr2 is indicated. The positions of the PCR genotyping primers (L1, L2, and R1) are indicated, and the legend shows the PCR genotyping for the wild-type (DJ) and osctr2 mutant. (B) qRT-PCR analysis of relative mRNA levels of OsCTR2 in DJ and osctr2 seedlings. (C, D) Seedling phenotype (C) and leaf length measurement (D) of the DJ and osctr2 plants. Numbers on the x-axis in (D) indicate the order of the seedling leaves (1, first; 2, second; 3, third). (E) Primary root length in DJ and osctr2 seedlings. (F) Number of adventitious roots in the DJ and osctr2 seedlings. **P<0.01 for osctr2 compared with DJ. (G, H) Leaf senescence (G) and chlorophyll a content (H) of DJ and osctr2 seedlings. (I, J) Phenotype (I) and length (J) of etiolated seedling coleoptiles of DJ and osctr2 plants. (K) Coleoptile phenotype of light-grown seedlings. (L) Ethylene evolution of DJ and osctr2 seedlings. Data in are means ±SD of three independent experiments performed in triplicate. **P<0.01. (M, N) qRT-PCR analysis of mRNA expression of genes in rice seedlings with prolonged (M; 7 d) or short (N; 4h) ethylene treatment (100 µl l–1). Data are means ±SEM of three independent experiments performed in triplicate. (This figure is available in colour at JXB online.)

