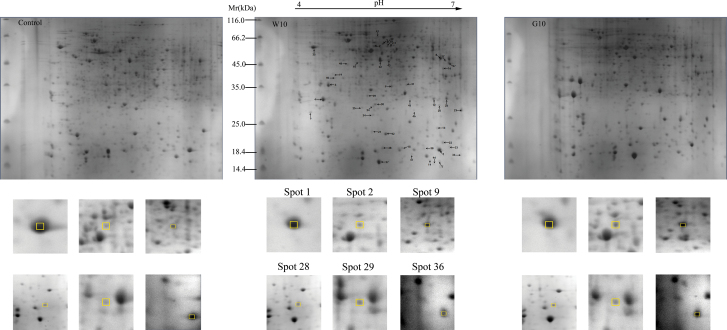
Fig. 2.
2-DE gel profiles of total proteins from the control, G10, and W10. The numbers of the 48 differentially expressed protein spots in response the GA4 and water treatment are marked with arrows and numbers, and the protein spot numbers corresponded to those listed in Tables 1 and 2. Magnified views of some of the differentially abundant proteins are shown below. Control represents GA4 or water treatment after 0 d, W10 represents water treatment after 10 d, and G10 represents GA4 treatment after 10 d. The boxes and numbers indicate different spots in the different treatments. (This figure is available in colour at JXB online.)

