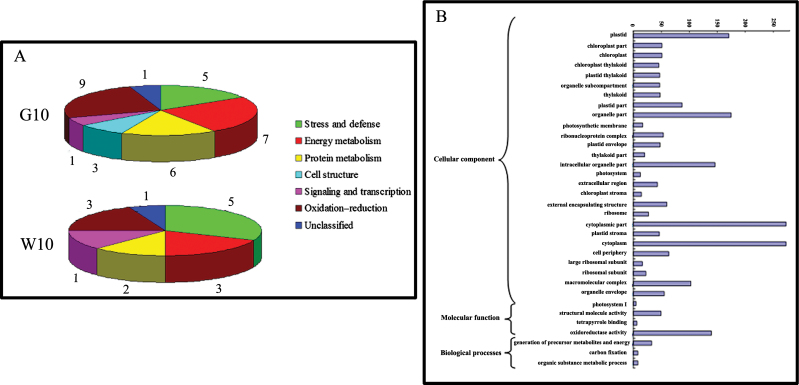
Fig. 3.
(A) Functional categorization of the differentially expressed proteins identified after 10 d of GA4 treatment (G10) and water treatment (W10). The digital gene expression number indicates the number of proteins in each subgroup. (B) Gene ontology functional enrichment analysis of differentially expressed genes after 10 d of GA4 treatment. (This figure is available in colour at JXB online.)

