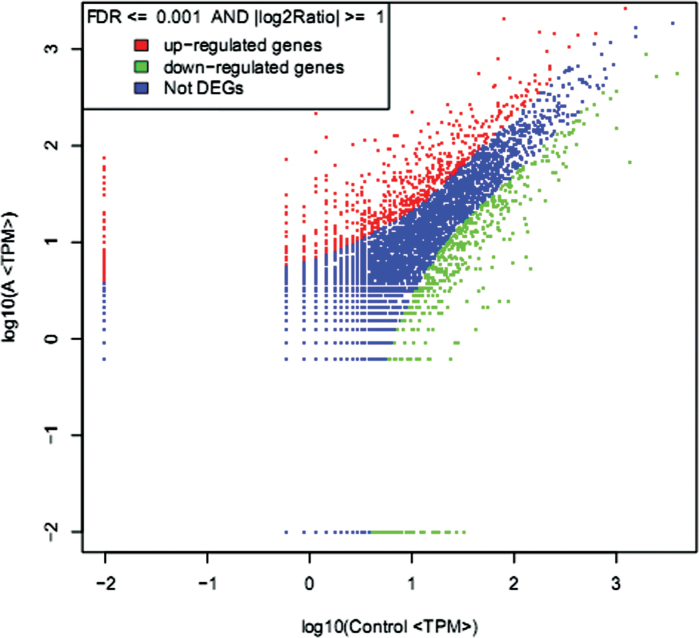
Fig. 4.
Comparison of transcripts expression between control and A libraries. The abundance of each gene was normalized as transcripts per million (TPM). The differential transcripts are shown in red and green, while blue indicates transcripts that were not differentially expressed (i.e. not differentially expressed genes). (This figure is available in colour at JXB online.)

