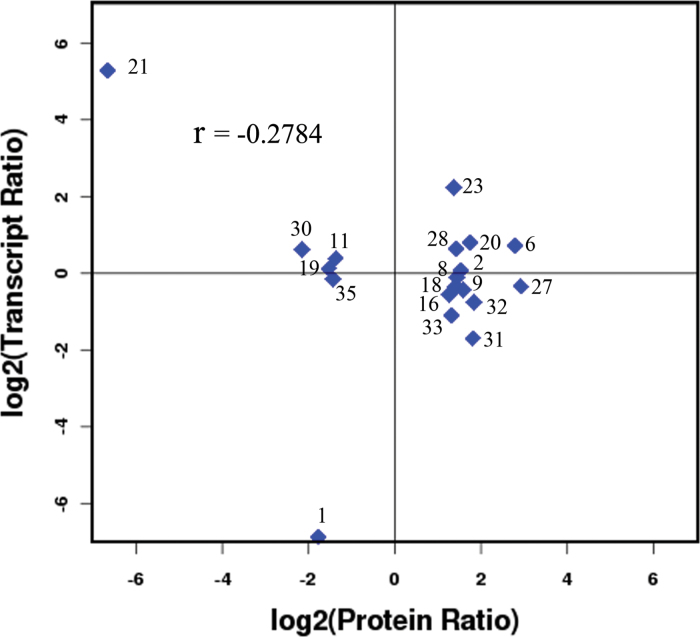
Fig. 5.
Correlation between the differentially expressed proteins and genes in the whole library. The x-axis shows the expression quantity of the differentially expressed proteins and the y-axis shows the expression quantity of genes in the whole library. (This figure is available in colour at JXB online.)

