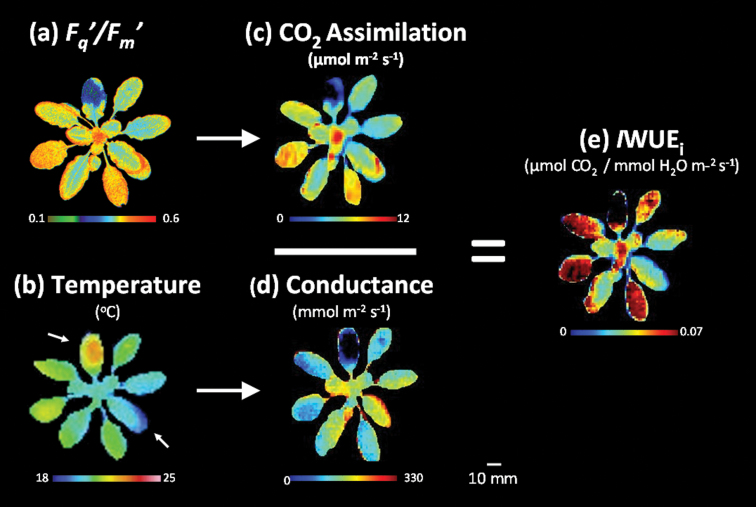
Fig. 3.
Typical (a) F q′/F m′ and (b) temperature images of an A. thaliana plant illustrating the production of (c) CO2 assimilation (A), (d) stomatal conductance (g s), and (e) intrinsic WUE (IWUEi) images. Calibrations were applied to convert pixel values within each image into A and g s data, respectively. The wet and dry temperature standards used in the calculation of g s are indicated by arrows on the temperature image. To produce an image of WUEi (A/g s=IWUEi), the A image was rotated, scaled, and interpolated onto the image of g s. The colour bar beneath each image shows the range of parameter values. For further details of this process, see Materials and methods.

