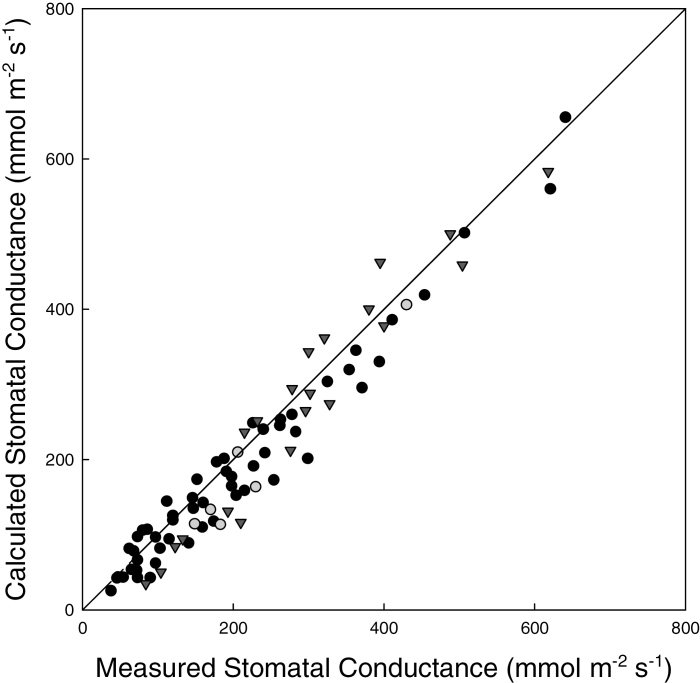
Fig. 5.
A comparison between stomatal conductance calculated from thermal images with that measured using an IRGA. To stimulate a range of conductances, leaves of Phaseolus vulgaris (filled circles) and A. thaliana thaliana Col-0 (grey circles) and WS-0 (triangles) were exposed to PPFDs between 200 µmol m–2 s–1 and 2000 µmol m–2 s–1. The solid line represents a 1:1 relationship (P < 0.0001, R s=0.96).

