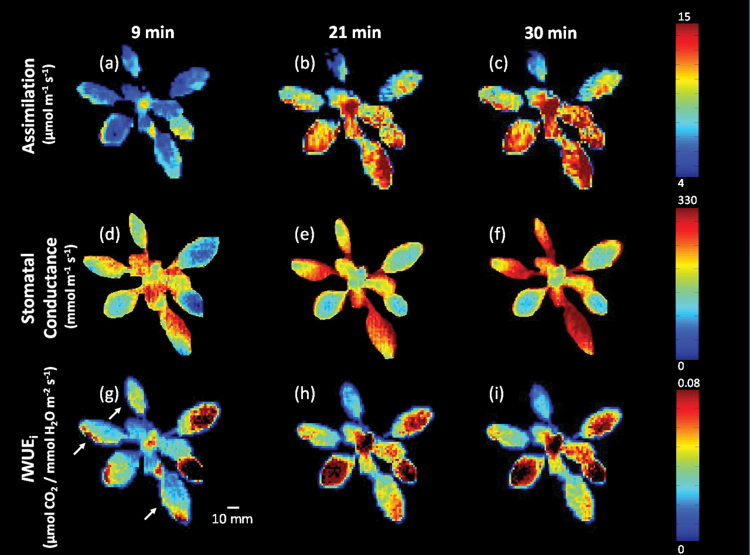
Fig. 8.
Images of CO2 assimilation, stomatal conductance, and IWUEi taken at 9, 21, and 30min as shown in Fig. 7. Arrows indicate older leaves selected for analysis. Air temperature and VPD were 25 °C and 1.2 kPa, respectively. The colour bars on the right show the range of parameter values.

