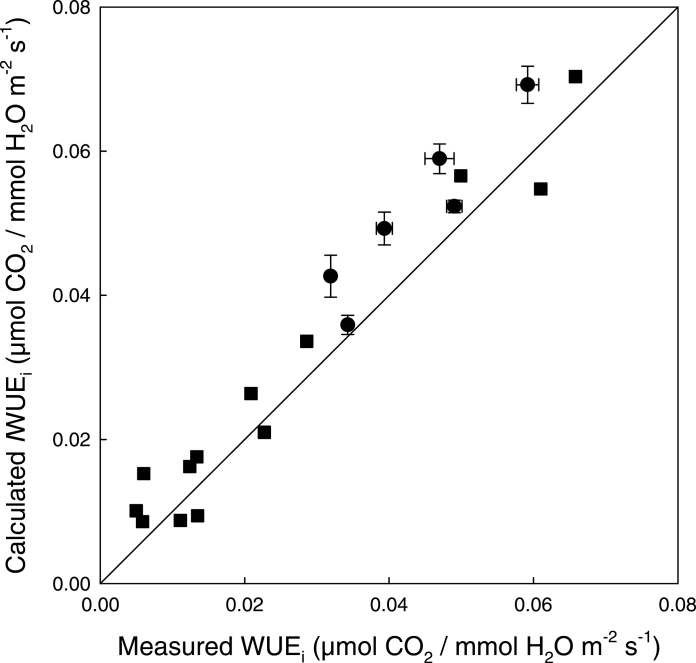
Fig. 9.
A comparison of IRGA measurements of WUEi and calculated values of IWUEi from images captured using the combined imaging system. WUEi was measured from leaves (circles) of A. thaliana during a step-wise change in light at a CO2 concentration of 400 µmol mol–1 (see Fig. 8); data are means with standard errors (n=5–8). Measurements were taken from individual leaves (squares) at CO2 concentrations between 100 µmol mol–1 and 2000 µmol mol–1. Air temperature and VPD were 25 °C and 1.2 kPa, respectively. The solid line represents a 1:1 relationship.

