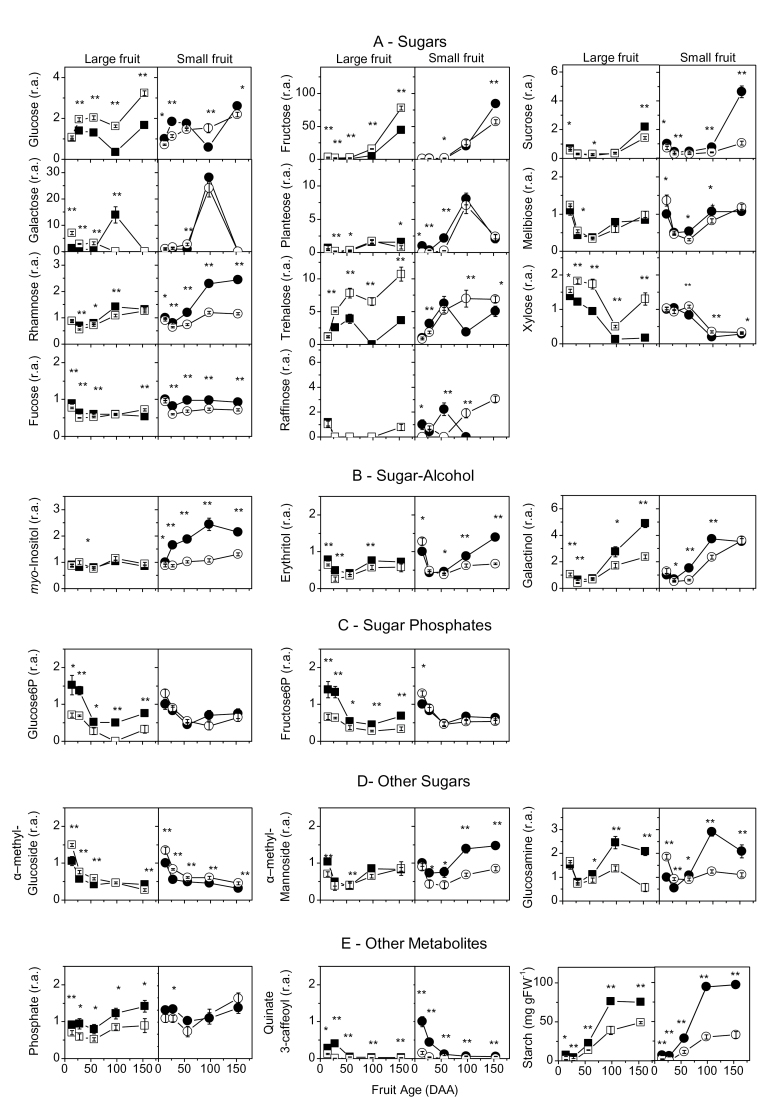
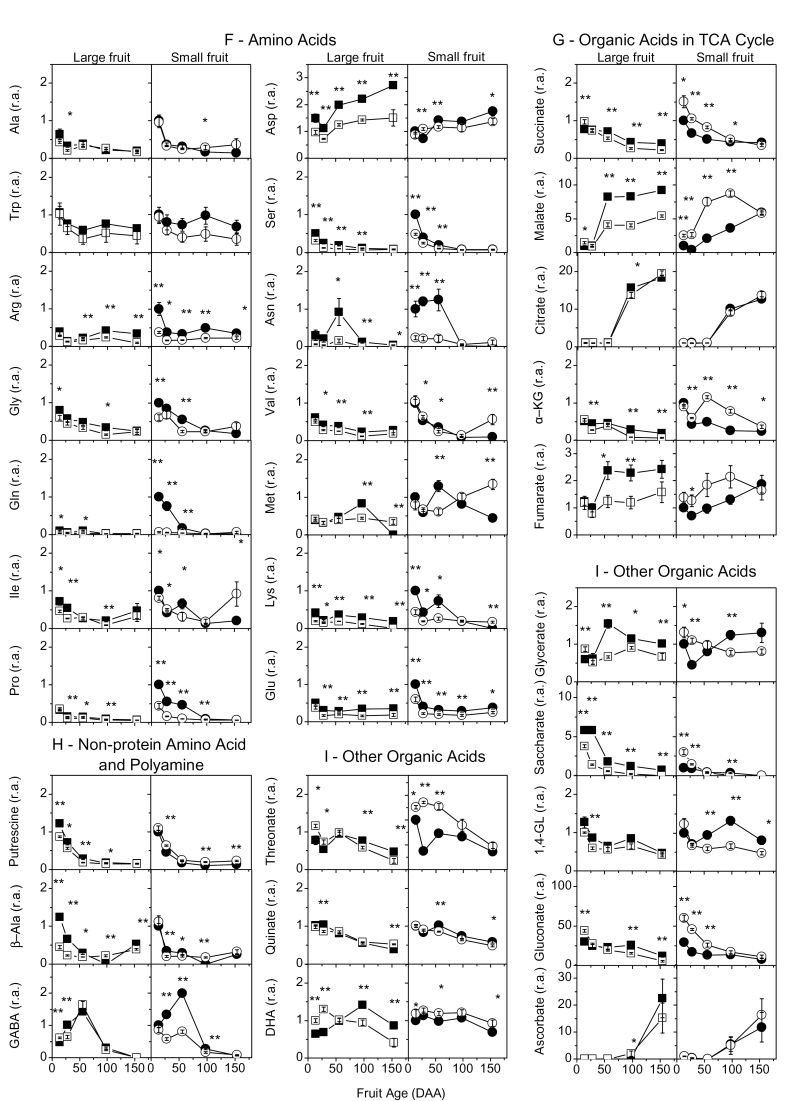
Fig. 1.
Changes in metabolite concentrations during fruit development of kiwifruit berries. Four genotypes were examined: G3, large fruit and high starch (filled squares); G25, large fruit and low starch (open squares); G30, small fruit and high starch (filled circles), and G17, small fruit and low starch (open circles). The 51 metabolites identified by GC-TOF-MS plus starch were subdivided into the following classes: A, sugars (Glc, Fru, sucrose, Gal, planteose, melibiose, Rha, Tre, Xyl, Fuc, raffinose); B, sugar-alcohols (myo-inositol, erythritol, galactinol); C, phosphate sugars (Glc6P, Fru6P); D, other sugars (α-methyl glucoside, α-methyl mannoside, glucosamine); E, other metabolites (phosphate, quinate 3-caffeoyl, starch); F, amino acids (alanine, tryptophan, arginine, glycine, glutamine, isoleucine, proline, aspartate, serine, asparagine, valine, methionine, lysine, glutamine); G, organic acids in the TCA cycle (succinate, malate, citrate, α-KG, fumarate); H, non-protein amino acids and polyamine (putrescine, β-alanine, GABA); I, other organic acids (threonate, quinate, DHA, gluconate, ascorbate, glycerate, saccharate, 1,4-GL). For each developmental stage, t-test significance levels are reported: *P < 0.05; **P < 0.01. Where the symbol is missing, the difference is not statistically significant. Fruit age is in days after anthesis (DAA); 1,4-GL, glucaric acid 1,4-lactone; DHA, dehydroascorbate; GABA, γ-aminobutyric acid; α-KG, α-ketoglutarate. Values are means of six biological replicates ±SEM. All data are expressed as relative amount (r.a.), with the exception of starch which is expressed as milligrams per gram fresh weight (mg g FW–1), and normalized to sample G30 at 14 DAA. Data refer to 2009 outer pericarp samples.


