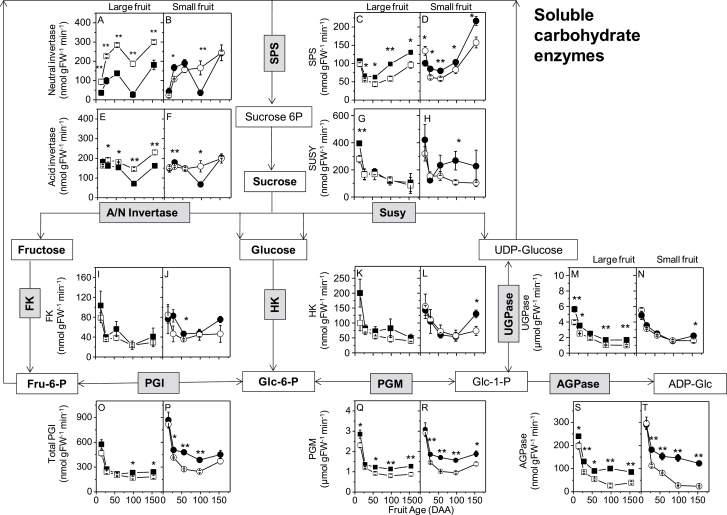
Fig. 2.
Kiwifruit soluble enzyme activities associated with Suc to starch metabolism. The graph for each enzyme activity is placed in proximity to the enzyme in the simplified pathway chart: A–B, neutral invertase; C–D, sucrose phosphate synthase; E–F, acid invertase; G–H, sucrose synthase; I–J, fructokinse; K–L, hexokinase; M–N, UDP-Glc pyrophosphorylase; O–P, total phosphoglucose isomerase; Q–R, phosphoglucomutase; S–T, ADP-Glc pyrophosphorylase. t-test significance levels are reported: *P < 0.05; ** P < 0.01. Where the symbol is missing, the difference is not statistically significant. Four genotypes were examined: G3, large fruit and high starch (filled squares); G25, large fruit and low starch (open squares); G30, small fruit and high starch (filled circles), and G17, small fruit and low starch (open circles). Enzyme codes: AGPase, ADP-Glc pyrophosphorylase; A/N invertase, acid and neutral invertase; FK, fructokinase; HK, hexokinase; PGM, phosphoglucomutase; PGI, phosphoglucose isomerase (total); SPS, sucrose phosphate synthase; SuSy, sucrose synthase; UGPase, UDP-Glc pyrophosphorylase. Metabolite abbreviations: ADP-Glc, ADP-glucose; Fru-6-P, fructose-6-phosphate; Glc-1-P, glucose-1-phosphate; Glc-6-P, glucose-6-phosphate. Fruit age is in days after anthesis (DAA). Values are means of four biological replicates ±SEM. Data refer to 2009 outer pericarp samples. White boxes, metabolites; grey boxes, enzymes; bold text, measured metabolites.

