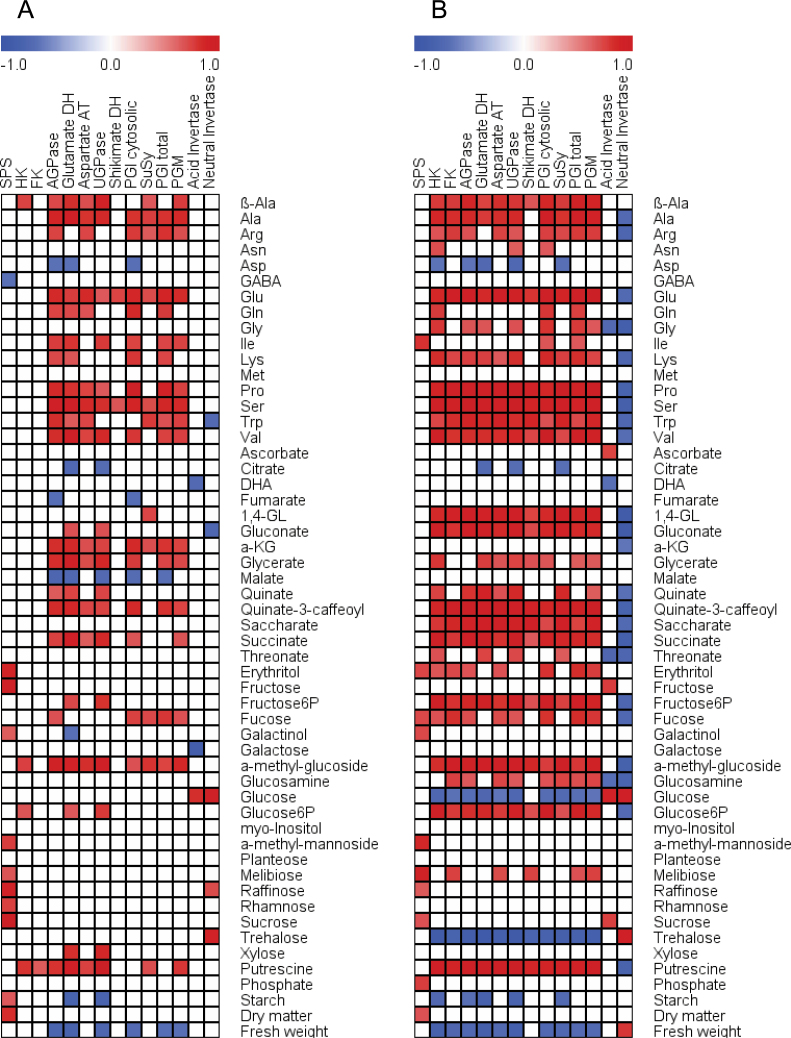
Fig. 4.
Metabolite to enzyme activity correlation matrix during fruit development of kiwifruit berries. (A) High-starch genotypes (G3 and G30); (B) low-starch genotypes (G25 and G17). The analysis included 51 metabolites analysed by GC-TOF-MS plus starch, fresh weight, and dry matter, and 14 enzymes. The significance threshold of P < 0.05 was used (open squares were not statistically significant). 1,4-GL, glucaric acid 1,4-lactone; DHA, dehydroascorbate; α-KG, α-ketoglutarate; AGPase, ADP-glucose pyrophosphorylase; Aspartate AT, aspartate aminotransferase; FK, fructokinase; HK, hexokinase; Glutamate DH, glutamate dehydrogenase; PGM, phosphoglucomutase; PGI, phosphoglucose isomerase; shikimate DH, shikimate dehydrogenase; SPS, sucrose phosphate synthase; SuSy, sucrose synthase; UGPase, UDP-glucose pyrophosphorylase. Data refer to 2009 outer pericarp samples.

