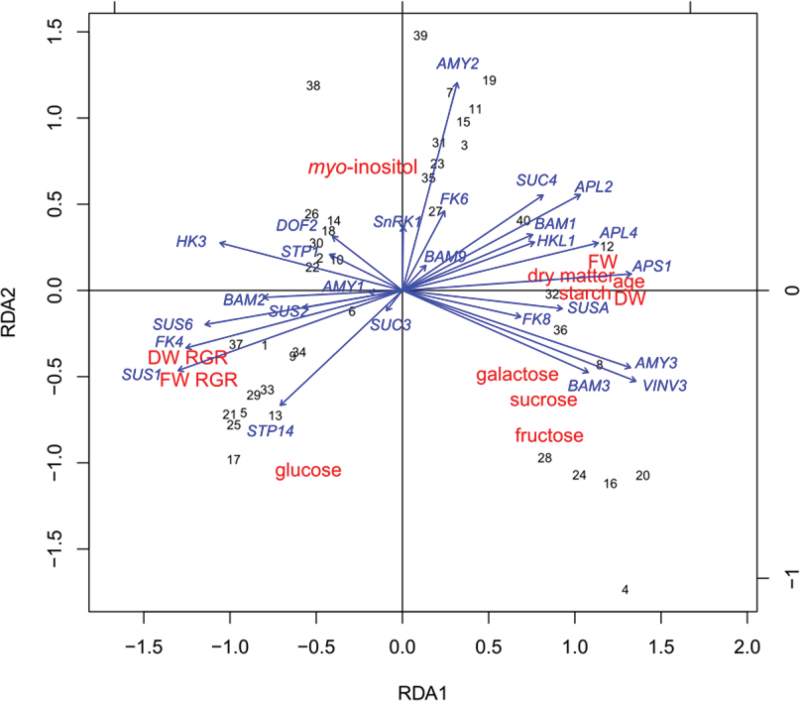
Fig. 5.
Redundancy analysis of physical measurements, growth rates, metabolites, and transcript levels obtained from kiwifruit genotypes. Fruit samples used in this analysis were collected in 2005 and in 2007 (Supplementary Table S1 at JXB online) and were representative of all fruit tissue types. Gene codes: α-amylase (AMY1, AMY2, AMY3), ADP-glucose pyrophosphorylase (APL2, APL4, APS1), β-amylase (BAM1, BAM2, BAM3, BAM9), DOF zinc finger (DOF2), fructokinase (FK4, FK6, FK8), hexokinase (HK3, HKL1), sucrose non-fermenting kinase (SnRK1), monosaccharide transporter (STP1, STP14), sucrose transporter (SUC3, SUC4), sucrose synthase (SUS1, SUS6, SUSA), vacuolar invertase (INV3). Other abbreviations: DW, dry weight; FW, fresh weight; RGR, relative growth rate. Numbers represent each genotype/sampling date combination (Supplementary Table S2 at JXB online). Colour coding: red, physical measurements and metabolites; blue, gene transcript abundance; black, sample number.

