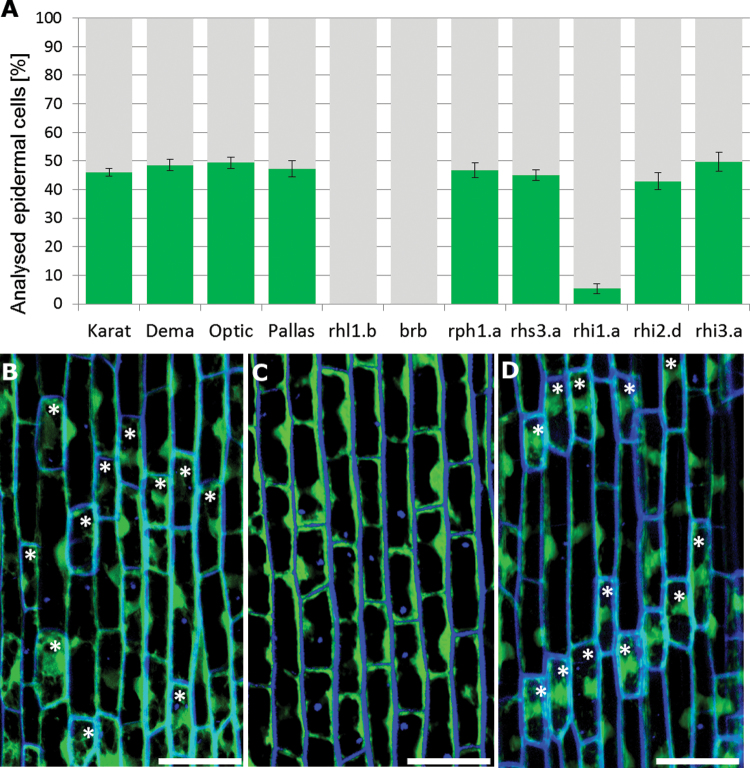
Fig. 2.
Shorter and longer epidermal cells in the elongation zone of barley roots. (A) Proportions of the two types of cell present in the root epidermis. Green represents shorter cells and grey represents longer cells. (B–D) Optical sections through the epidermal layer of cv. ‘Dema’ (B), mutant rhl1.b (C), and mutant rhi2.d (D) after staining the cytoplasm with an FDA solution. Asterisks indicate shorter cells (dense cytoplasm). Bars, 50 μm.

