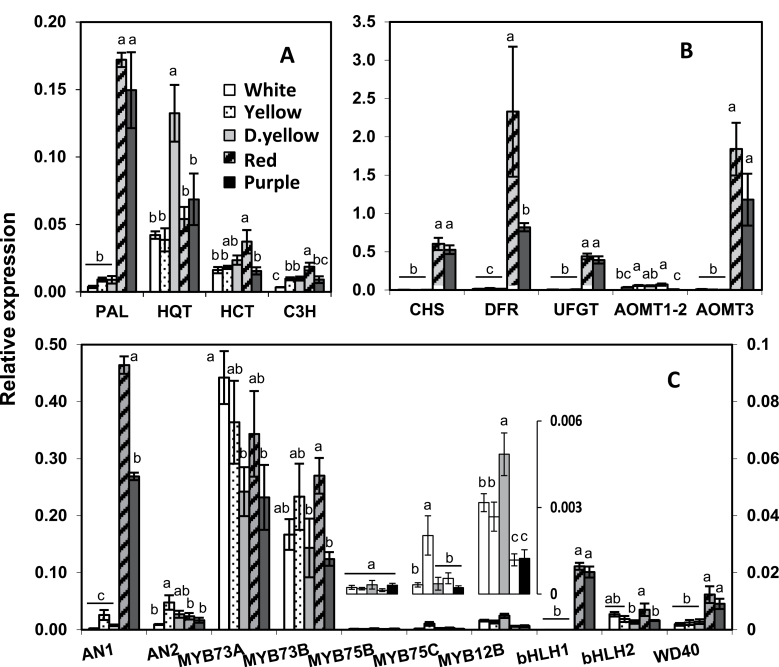
Fig. 5.
Gene expression in the five genotypes. Expression of structural genes from the early (A) and late (B) phenylpropanoid pathway, or genes encoding transcription factors (C). In (C), only AN1 uses the left y-axis, and all others use the right axis. In the inset are expression values of MYB75B, MYB75C, and MYB7512B. The data represent the means±SEM of three biological replicates. Values with the same letter are not significantly different (P<0.05).

