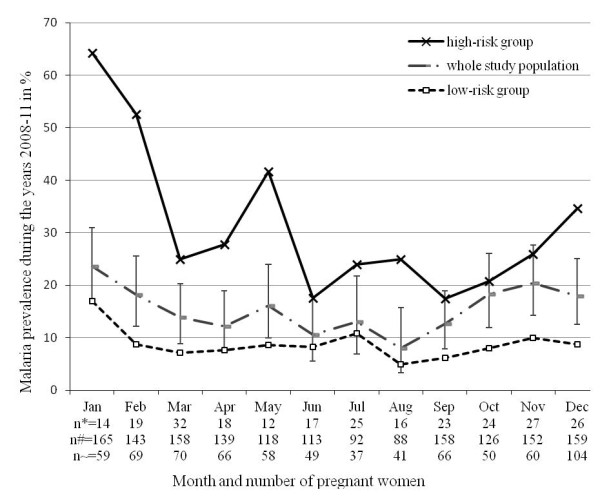
Figure 1.

Seasonal prevalence of malaria in pregnancy of high-risk versus low-risk groups during the study period 2008–2011. The malaria prevalence is aggregated by month for all the years 2008 until 2011. The solid curve (drawn in black) is a high-risk group composed of nulli-, primipara pregnant women and age group 1. The dashed curve (drawn in grey) includes the whole study population, 95% confidence intervals are given as error bars. The dashed curve (drawn in black) is a low-risk group composed of multipara and age group 2–4. The number of pregnant women by month is given for all groups (n* = high-risk group, n# = whole study population, n ~ = low-risk group).
