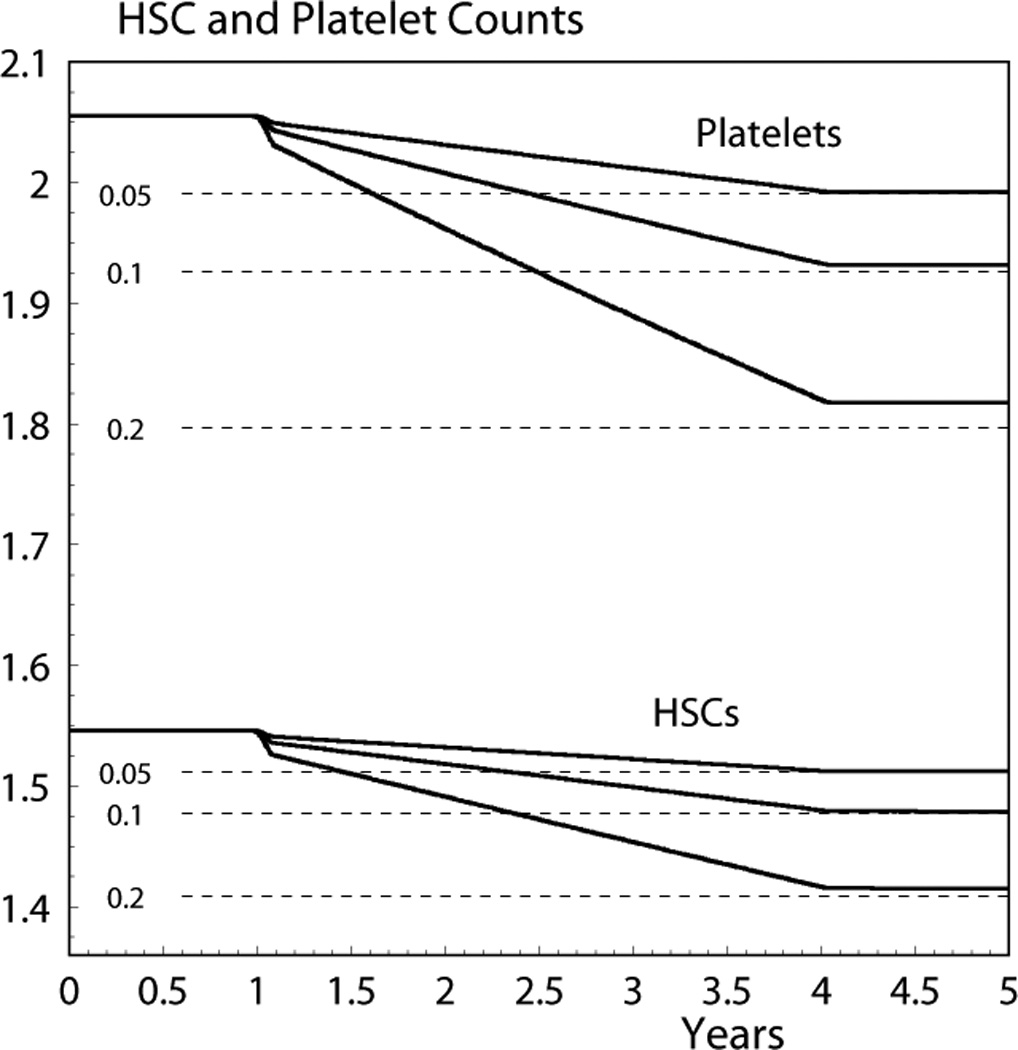
Fig 2.

Five-year dynamics of HSC (in 106 cells/kg) and platelet (in 1010 cells/kg) counts given by Eq. (1); the dashed line shows the final steady state given by the approximate model (Eqs. 4 and 6). The numbers at the left of the dashed lines denote dose rate in Gy/year for which the dynamics were calculated.
