
Fig 3.
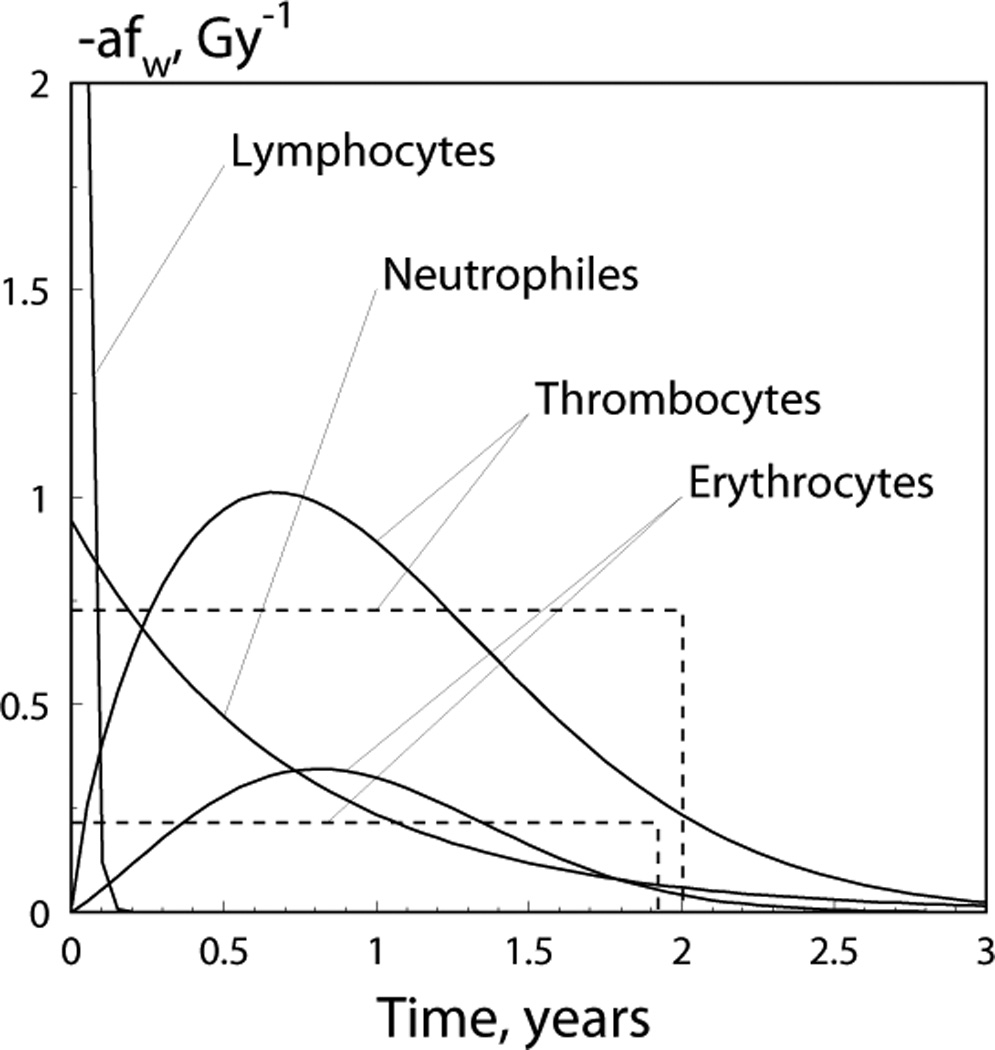
The distribution fW (u, {θW}) (multiplied by −α) describes the delayed dose-rate effects for four blood lines (see Eq. (9) for definition of fW (u, {θW}) and Table 3 for parameter estimates); the dashed lines show alternative distribution (i.e., uniform distribution) models for mixing distributions, for platelets and erythrocytes; the point where the graph intersects with the y-axis for lymphocytes is 42.01 Gy−1.