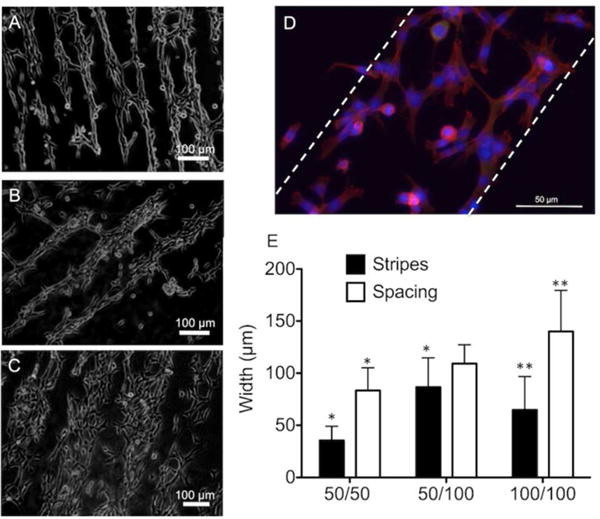
Figure 5.

Representative optical micrographs of NIH3T3 fibroblasts patterns on micropatterned PS substrates with (A) 50 μm stripes/50 μm spacings, (B) 50 μm stripes/100 μm spacings, and (C) 100 μm stripes/100 μm spacings at 24 hr after seeding. The data presented herein is compiled from at least five different images captured on three independent days of experimentation. (D) Representative fluorescent images of adherent NIH3T3 fibroblasts on substrates with PNIPAM micropatterns of 100 μm stripes/100 μm spacings. Dashed lines indicate cell pattern. Actin and nuclei were stained with AlexaFluor568-phalloidin (red) and DAPI (blue), respectively. Cellular focal adhesions were stained with anti-vinculin fluorescein (green). (E) Histogram of cells adhered on patterned PNIPAM substrates with stripe widths and spacings of 50 μm stripes/50 μm spacings, 50 μm stripes/100 μm spacings, and 100 μm stripes/100 μm spacings. * p<0.05 versus hypothetical value 50.0 calculated using one-sample t-test and ** p<0.05 versus hypothetical value 100.0 calculated using one-sample t-test. n=13, error bars represent standard deviation.
