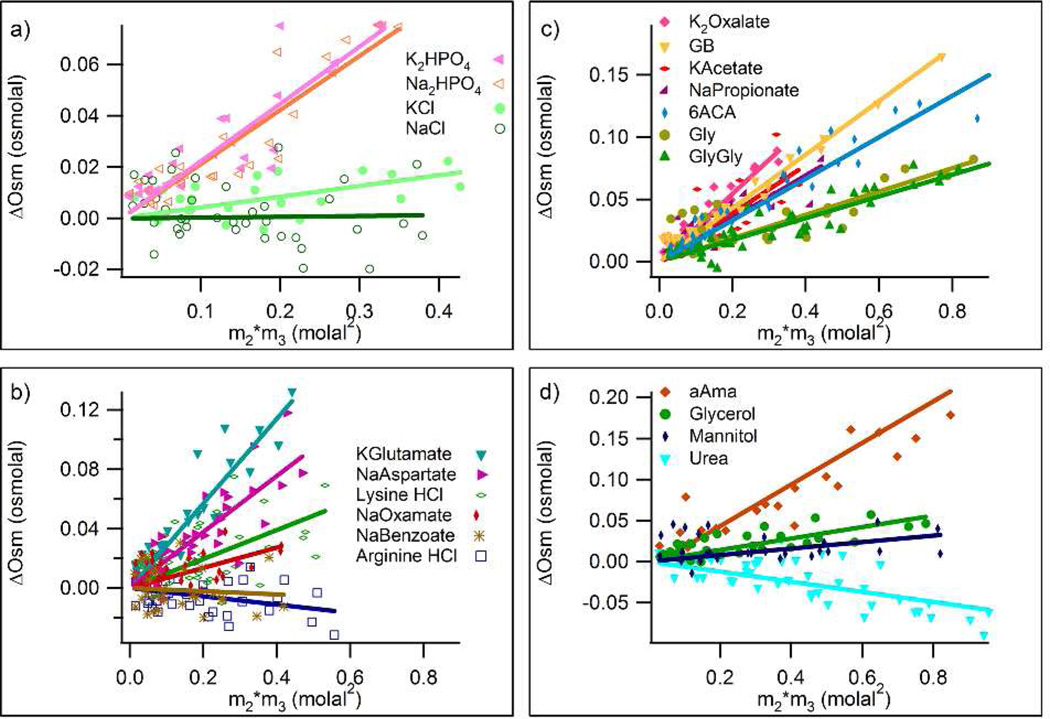
Figure 1.
Quantifying Interactions of Proline with Soluble Model Compounds by Osmometry. Excess osmolalities ∆Osm of three component solutions of model compound and proline, determined by VPO, are plotted as a function of m2m3, the product of the molal concentrations of model compound and proline. Groups of model compounds are: a) inorganic salts, b) organic salts, c) carboxylate salts and zwitterions, and d) uncharged species. Linear least-squares regression lines are shown for all compounds, with slopes equal to µ23/RT (Eq.1).

