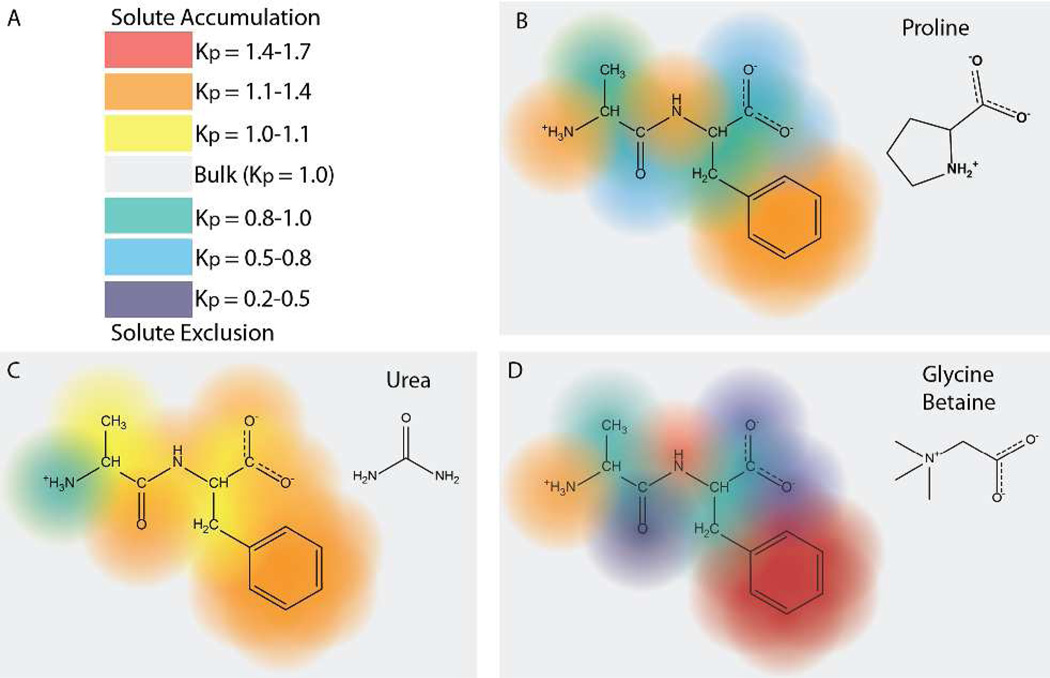
Figure 5.
Predicted Accumulation or Exclusion of Proline from the Functional Groups of the AlaPhe Dipeptide; Comparison with Urea and Glycine Betaine. Panel A gives a color scale of local partition coefficients Kp (see Eq. 5) used to quantify the accumulation (Kp>1; red to yellow) or exclusion (Kp<1; green to violet) of a solute like proline in the vicinity of functional groups of a model compound or protein. Panels B – D illustrate the predictions using Kp values from Table 1 for the accumulation or exclusion of proline (B), urea (C) and GB (D) in the vicinity of individual functional groups of the AlaPhe dipeptide. Note the relatively uniform accumulation predicted for urea (except at the ammonium group), as contrasted to the large differences in accumulation and exclusion of proline and GB at the different functional groups of AlaPhe.

