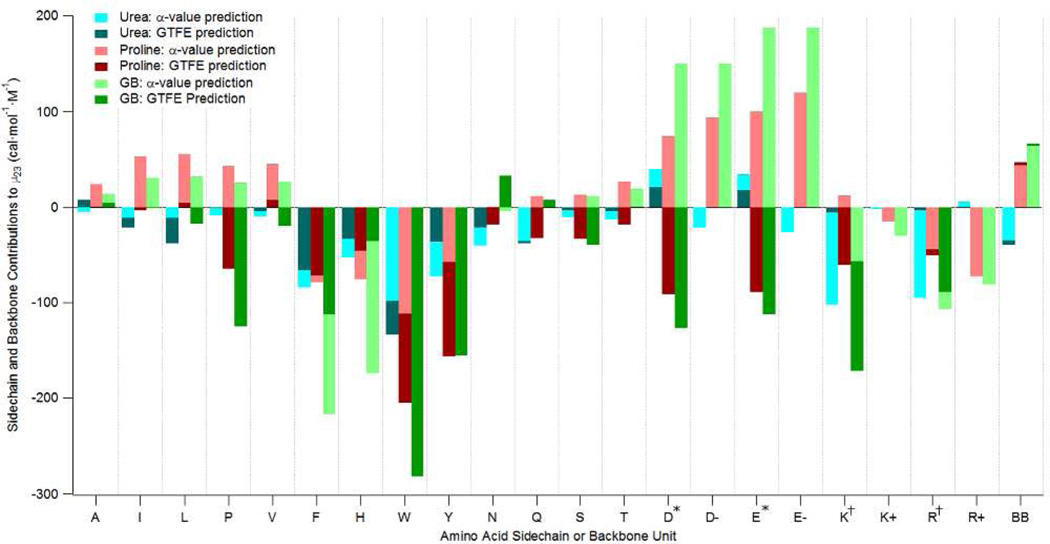
Figure 6.
Comparison of α-Value and Group Transfer Free Energy (GTFE) Predictions of Interactions of Proline, Urea and GB with Amino Acid Side Chains and the Peptide Backbone (BB). α-Value predictions use functional group α-values from Table 1 (converted from molal to molar scale at 1 M) and ASA information from Supp Table S2. GTFE predictions are from ref 29; values for W and Y side chains were not given. α-Value predictions for charged side chains are given both without counterion (specified as D−, E−, K+, R+) and with counterion (D*, E*, K†, R†; where * indicates Na+ and † indicates Cl−. For charged side chains, GTFE predictions are only available with counterion (i.e. D*, E*, K†, R†) Values for histidine are for the uncharged sidechain. For both α-value and GTFE predictions, the backbone is modeled as half the surface area of cyclic glycylglycine (cGG/2). Values plotted are equivalent to free energies of transfer from water to 1M solute.

