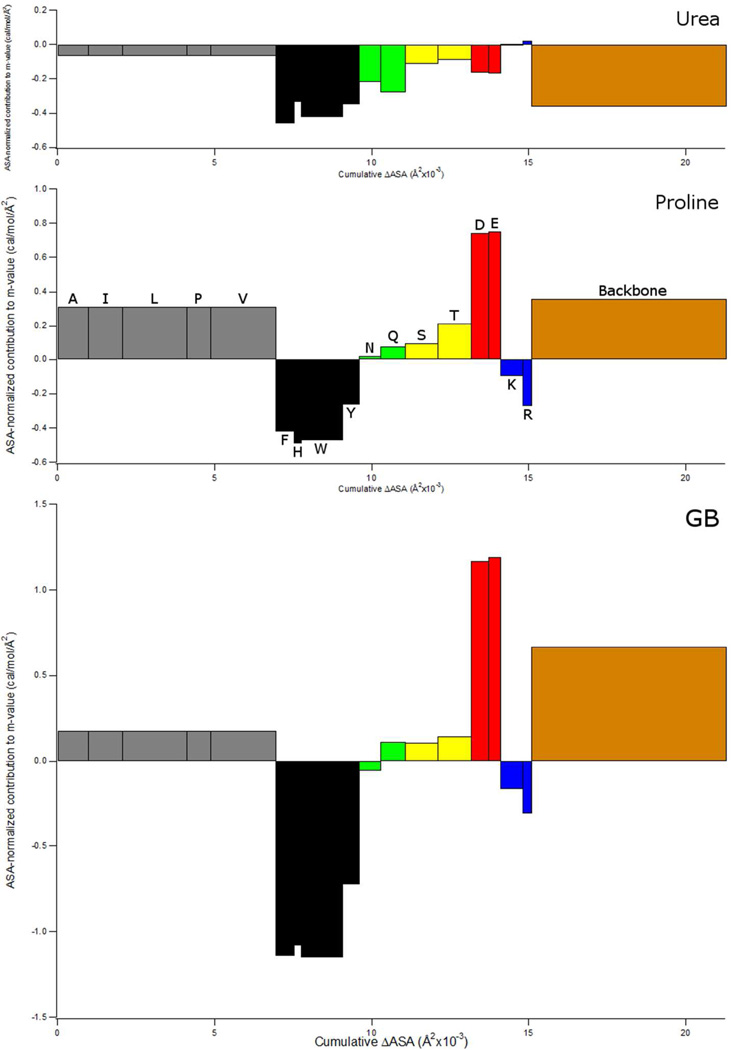
Figure 7.
Comparison of α-Value Predictions of Backbone and Side Chain Contributions to Proline (Panel B), Urea (Panel A) and GB (Panel C) m-values for unfolding chymotrypsin (PDB Code 1YPH). For each side chain or the peptide backbone, the area of the rectangle is the contribution to the m-value, and is the same as the contribution to µ23 (or ∆µ23) predicted from α-values and ASA information in Fig. 6. Width of rectangle is the total amount of accessible surface area of that sidechain (or backbone) exposed in unfolding chymotrypsin, and height of rectangle is the contribution per A2 of that sidechain or backbone to the m-value. The same scale is used for all three solutes. Bar color denotes type of amino acid (aliphatic amino acids are grey, aromatics are black, amides are green, hydroxyls are yellow, anionic are red, cationic are blue, and the backbone is brown). Cysteine and methionine are not shown.

