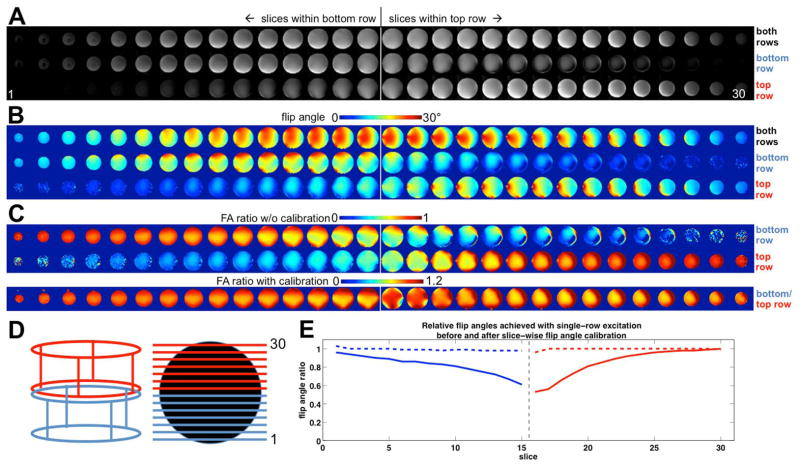
FIG. 5.
Flip angle maps and calibration. Panel (A) shows 30 EPI slices spanning the entire coil volume (150 mm). The top row shows the images obtained when using the coil in its combined CP mode (both rings excite each slice); the middle and bottom row show the corresponding slices when exciting with only the bottom or top row in their individual CP modes, respectively, with no flip angle adjustment. The divide between the slices that fall within bottom and top rows is indicated by the vertical line. (B) shows the corresponding flip angle maps obtained with the dual-angle method. The nominal target flip angle is 22 degrees. Ratios of the flip angle achieved with single-row excitation vs. combined mode excitation without transmitter adjustments are shown in the top two rows of (C). As expected, a reduced B1+ is observed especially in the region where both rows contribute significantly to the excitation, but not in the lower and upper slices. The bottom row of (C) shows the ratio maps after adjustment of the RF pulse voltage for each slice to give the same mean flip angle as the combined-mode excitation. A plot of the flip angle ratios for each slice before (solid lines) and after (broken lines) flip angle adjustment is shown in (E), demonstrating successful restoration of mean flip angle. Throughout, red and blue colors indicate excitation with top and bottom row, respectively. (D) shows a schematic of the coil row selection, and slice positioning and numbering.

