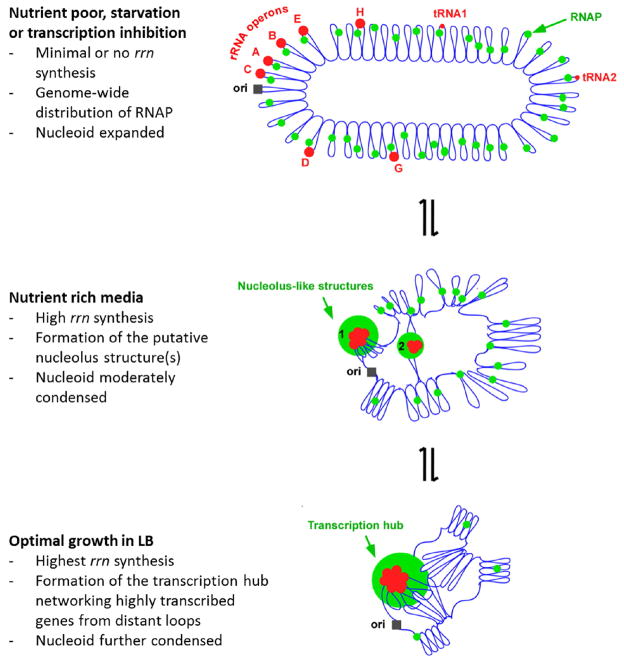
Figure 14.
A model illustrating how transcription foci compact the nucleoid in fast growing cells in LB. The nucleoid organization is dynamic and sensitive to the pattern of RNAP distribution which responds to changes in growing environments. The E. coli chromosome is represented as blue lines folded in loops, the ori of replication as a black square, the seven rRNA operons as large red circles with letters, and two representative tRNA operons as small red circles. The RNAP molecules are represented as small green circles. In very slow growing or nutrient starved cells (top), RNAP distributes relatively evenly across the nucleoid for broad global gene expression leading to the full “open” state of the nucleoid or nucleoid expansion. Inhibition of transcription by rifampicin has a similar effect on the nucleoid because RNAP scatters across the nucleoid homogenously. During rapid growth (middle), RNAP is concentrated at the putative nucleolus structures (~1% of the genomic DNA) and biased for rRNA synthesis, leaving only a small fraction of RNAP in the vast remaining regions of the nucleoid, leading to nucleoid compaction. For simplicity, only two nucleolus-like structures which make the nucleoid more compact by pulling different rrn operons (red cluster) into proximity in a nascent nucleoid are shown. During optimal growth (bottom), the transcription foci represent transcription hubs networking with the transcription of other genes located in distant loops, further condensing the nucleoid. The transcription hub is indicated. See text for details.

