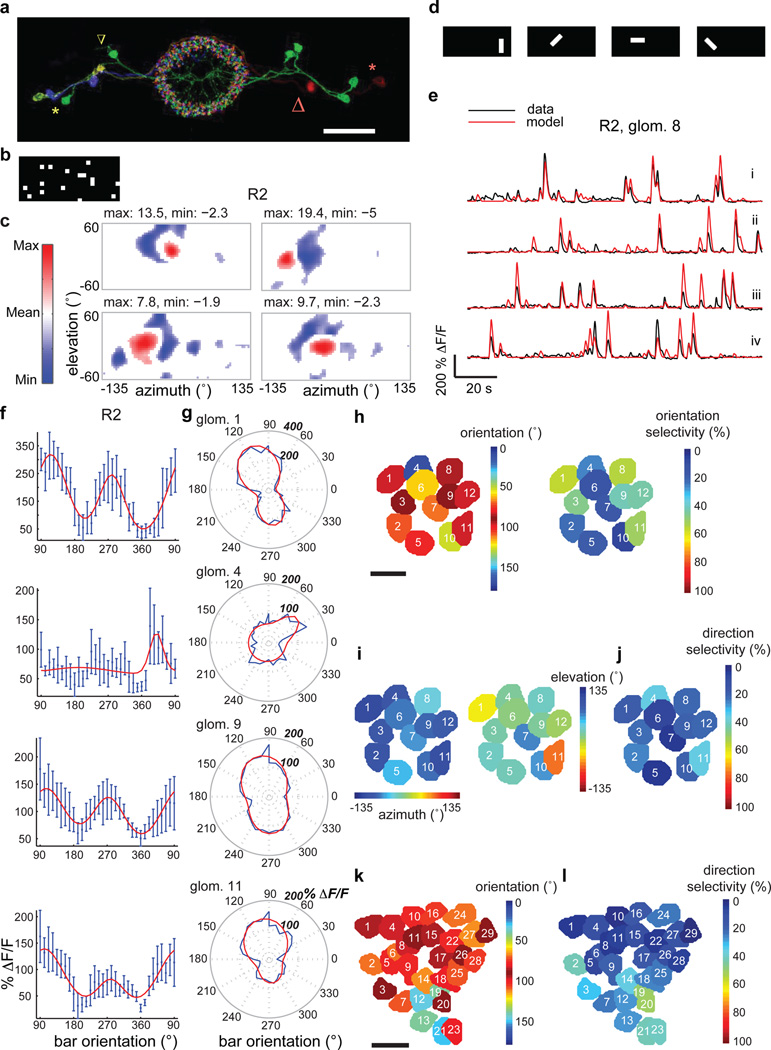
Figure 2. Ring neurons are tuned to specific visual features and orientations.
a, Multicolor FLP-out of R2 neurons showing three cell bodies on each side along with their color-matched microglomeruli (green, light green and purple at left; two green and one red at right). Red and yellow stars mark two cell bodies (one on each side, lateral) and arrows of like color their respective LTr microglomeruli (medial). All neurons send processes throughout EB rings. Scale bar: 30µm. b, Example frame of white noise stimulus used for RF mapping using reverse correlation. c, Sample RFs of R2 microglomeruli. Red subfields: excitatory responses > 30% of maximum; blue subfields: inhibitory responses < 30% of minimum of mean-subtracted weighted average. See Extended Data Fig. 8 for all RFs. d, Bright bars with four different orientations used as test features. e, Modeled and actual (black) ΔF/F changes of an R2 microglomerulus in response to differently oriented bars (fly 2 in Extended Data Fig. 7). In red: (i) trial used for fitting parameters, and, (ii)–(iv) tests. f, Orientation tuning curves for R2 neurons (two-trial average, fit in red). 90° corresponds to back-to-front movement of vertical bar, 270° to front-to-back movement of vertical bar. Error bars: standard deviation. g, Polar plots of orientation tuning data and fits (red) for data shown in f. h, Microglomeruli of R2 neurons colored by orientation preference (collapsed to 0°–180°) and orientation selectivity (two-trial average). i, Same microglomeruli as in h colored by azimuth and elevation of center of their excitatory RFs, measured using horizontally moving bars as described in Extended Data Fig. 1 (two-trial average). j, Direction selectivity of same microglomeruli (two-trial average). k, Preferred orientation (collapsed to 0°–180°) and l, direction selectivity of microglomeruli in pan-neuronal line (both four-trial average). See Methods for analysis details. Scale bar for h–k: 5µm.

