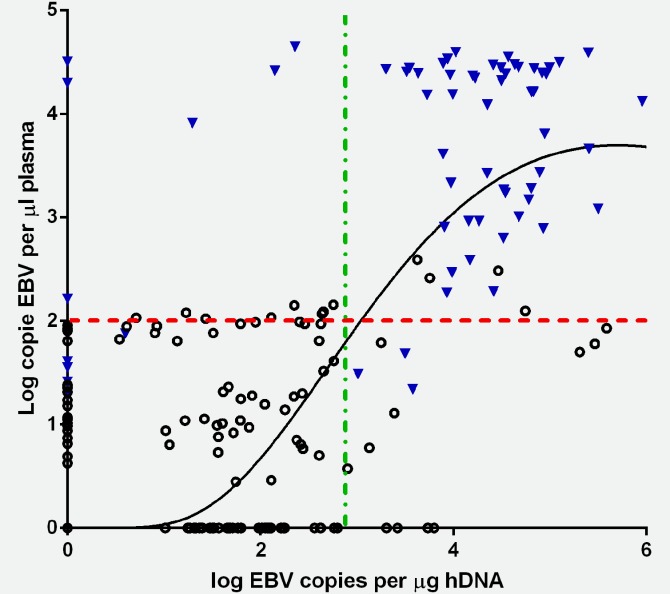
Figure 2.

Correlation between cellular and plasma EBV levels for healthy and eBL children. There was a significant correlation between cellular and plasma EBV levels in healthy Kenyan children from Nyanza (triangle) r = 0.177, p-value = 0.010. Children diagnosed with eBL had a nonsignificant correlation coefficient of r = 0.243, p-value = 0.05 (open circles). Based on the area under the ROC curve to assess sensitivity and specificity, dashed lines at 2-log EBV copies per microliter of plasma and 3-log EBV copies per microgram of human DNA were selected to visualize viral loads in healthy Kenyan children (triangle) and eBL patients (open circles) as a proposed threshold if either were used as a biomarker. [Color figure can be viewed in the online issue, which is available at wileyonlinelibrary.com.]
