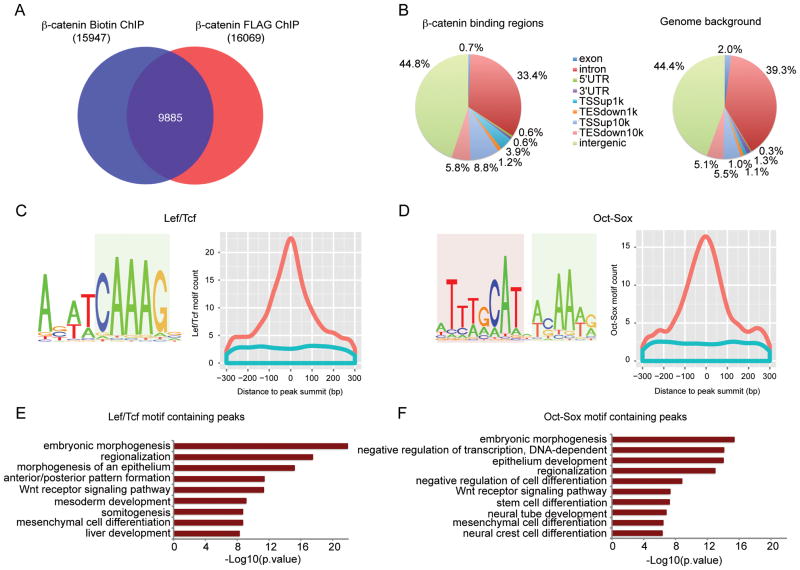
Figure 1. Genome-wide mapping of β-catenin binding regions in mESCs cultured in CM.
(A) Venn diagram showing the overlap between β-catenin Biotin ChIP-seq and FLAG ChIP-seq peaks.
(B) Genome-wide distribution of β-catenin binding regions relative to mouse genes compared with random control region genomic distribution. Binding regions were annotated as exon, introns, 5′ un-translated region (5′ UTR), 3′ UTR, within 0–1 kb upstream of TSS (TSSup1k), within 1–10 kb upstream of TSS (TSSup10k), within 0–1 kb downstream of TES (TESdown1k), within 1–10kb downstream of TES (TESdown10k), or > 10kb away from the nearest genes (intergenic).
(C) (D) Top enriched motifs recovered from de novo motif analysis of β-catenin binding regions. Left panels show motif logos. HMG box motif is highlighted in light blue, and POU family motif in light red. Right panels show histogram of motifs ± 300bp around peak summit of β-catenin (orange) or matched control peak (blue).
(E) (F) GO terms enriched for β-catenin peaks containing Lef/Tcf motif (E) or Oct-Sox motif (F) using GREAT. The –log10 of the raw binomial p-value is reported.

