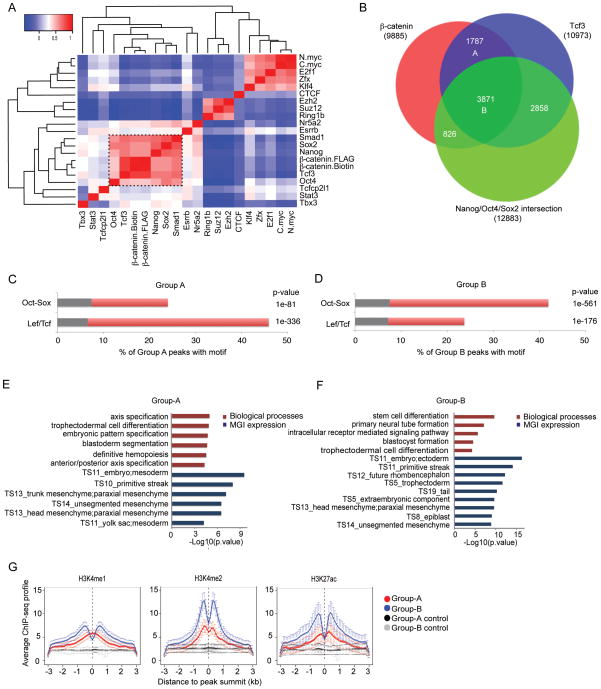
Figure 2. Characterization of β-catenin and ESC pluripotency factors binding.
(A) Heat map depicting the correlation of β-catenin and ESC factors bindings. Red: positive correlation; blue: negative correlation.
(B) Venn diagram of β-catenin, Tcf3, and intersection of Nanog/Oct4/Sox2 peak regions. Two groups of peaks are highlighted: Group-A: β-catenin::Tcf3, and Group-B: β-catenin::Tcf3::NOS.
(C) (D) Enriched motifs in Group-A and Group-B. Red: motif occurrence in β-catenin peaks; grey: motif occurrence in matched control regions with the same coverage. P-value was calculated according to two proportion z-test.
(E) (F) Functional annotation of Group-A and Group-B regions using GREAT. The –log10 of the raw binomial p-value is shown.
(G) Aggregation plots of H3K4me1, H3K4me2, and H3K27ac signals ±3 kb around the peak summit for binding regions in Group-A (red) and Group-B (blue) as well as corresponding matched control regions with standard error bars (black and grey). The analysis is done using HOMER 75. Bin size 100 bp.

