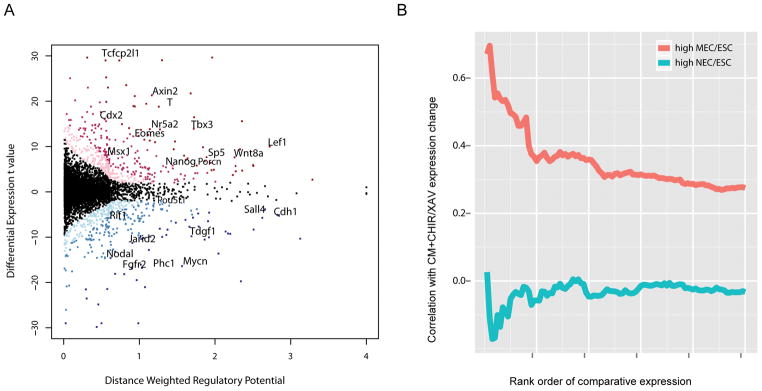
Figure 4. Integration of β-catenin ChIP-seq and expression profiling in mESCs treated with an activator or inhibitor of canonical Wnt signaling.

(A) Scatter plot of β-catenin direct target gene prediction based on distance weighted regulatory potential score from ChIP-seq and t-value of differential CHIR/XAV expression in CM. Red dots: up-regulated genes with FDR < 0.10; blue dots: down-regulated genes with FDR < 0.10. The darker red/blue represents the higher likelihood for a gene being β-catenin direct target. The horizontal and vertical histograms reflect the distribution of the index for distance weighted regulatory potential and differential expression t value, respectively. Representative genes are labeled.
(B) Correlation of top 1000 genes of high MEC/ESC or NEC/ESC expression ratio (from microarray data in Shen et al.63) (x-axis) with their differential expression fold changes in CM+CHIR/CM+XAV (y-axis). Genes were ranked by their expression ratio in MEC versus ESC or NEC versus ESC from high to low. For the top 1000 genes in the two ranks, their expression ratio in CM+CHIR versus CM+XAV were checked. Bins represent the top 20 genes, then the top 40 genes, etc., as determined by the MEC/ESC ratio or NEC/ESC ratio. The correlation of MEC/ESC or NEC/ESC ratio with CM+CHIR/CM+XAV ratio for each bin were calculated and plotted.
